One of the things I get to do as part of my consulting at trade-ideas is learning about new indicators and trading styles. Doing this work often gives me some great ideas for things to test on my trading and analysis of the markets.
One of my trading mentors and friend, Brian Shannon, has written a new book “Maximum Trading Profits Using Anchored VWAP” (Check it out here) and has inspired some of my most recent projects. I am sure there will be many of these posts about AVWAP soon, as there is much to learn from the book. This also meant I had many to test and tweaks to make to my trading. Let’s focus on one that immediately stuck with me as a filter to improve your trading results, the anchored VWAP from the beginning of the year.
One of the ways that AVWAP can be used is as a simple sentiment indicator. AVWAP represents the true average price of a stock, including volume from a point in time, so we can anchor it from the start of the year, as this is where we anchor so many other things. We look at our PnL on a YTD basis, and funds are paid off YTD returns. Reading this in the book proposed a theory to me. If I only owned stocks over their YTD, AVWAP could help me filter out names to trade and using YTD, AVWAP could keep me in the strongest names. Let’s test!
In my last post about moving average slopes (Read here if you missed it), we built a simple trend-following system.
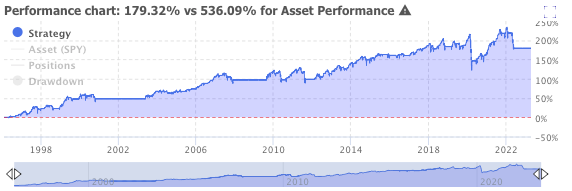
We refined that system showing that adding the slope of the 200-day moving average did an excellent job of keeping us out of bear markets. This is a pretty good system already, but let’s see what happens with testing YTD AVWAP on the same security (S&P 500) and over the same timeframe.
In this base system, we achieve around a 175% return over the 27-year backtest using only the S&P 500.
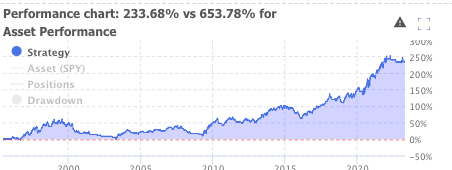
Now let’s start again, look only at AVWAP and make it simple. We will own the S&P 500 if it’s over the YTD AVWAP and sell it when it’s under. On a % basis, this beats our last scan but has some issues with the win rate as the market chops around that AVWAP price.
But already we can see the increase in returns up to nearly 250%.
We can smooth this out using a moving average to remove that choppiness. In the lower chart, we hold the S&P 500 when the 10-day moving average or price exceeds the YTD AVWAP and sell when it’s under.
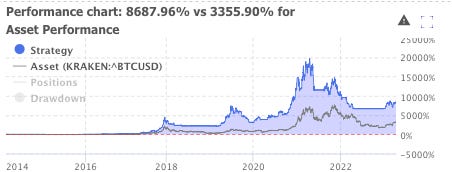
That simple change lets the power of this sentiment indicator shine, letting us experience the yearly rallies and sit out of most of the bear markets. For fun, I applied this same system on Bitcoin in the chart below and beat buy and hold by around 5000%.
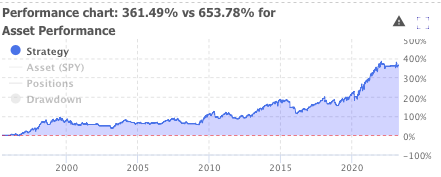
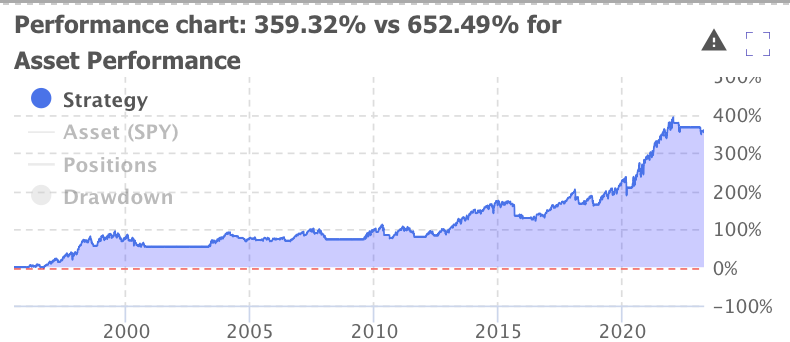
Now let’s tie it all together. This last backtest brings in the MA slope from my last post. In this one, we own the market only when the 10-SMA is over the YTD AVWAP and the 200-day is sloping higher.
Combining and testing ideas like this can sometimes unlock unexpected results. We were not only able to keep our returns from the AVWAP strategy, but we can be completely in cash during most major bear markets.
Being in cash like this either allows us to ignore market turmoil entirely or switch to other systems in these markets.
I think this system works for a few reasons. First, there is some evidence that if markets are down at the beginning of the year, they can move lower for the rest and vice versa.
Secondly, following the trend works. A system to get us into a strong market and move to the side when things turn will always help us come out on top.
It’s not only a way to chart out areas of dynamic support and resistance, but it's also turning out to be a quantitative tool to help filter weakness out of the markets.
If you want more content check out my socials below. For daily market commentary and my personal swing stock list for less than a dollar a day, come check out my products over at StatsEdgeTrading
Lastly, at trade-ideas, we have launched a new product with Brian that will help you find stocks trading over the YTD AVWAP, and the system will draw the AVWAP for you. Here


