Hello everyone, and welcome to a more detailed than usual weekly and monthly market wrap-up. Today, we'll explore an array of financial markets—from stocks and cryptocurrencies to Forex. We'll dive into individual names I'm watching closely and analyze the new monthly and weekly candles that have formed. Whether you agree or disagree with my observations, I encourage you to engage in the comments section below.
Resource Reminder: Before we delve deeper, make sure to check out the free trading course available at statsedgetrading.com. I would also like to remind you about the trading course with an introductory price. This offer will end on Monday, so don't miss out on the opportunity before the price returns to normal. Additionally, signing up for the free email list on my site is crucial as it's the primary way I share insights and updates about my trading algorithms and market thoughts.
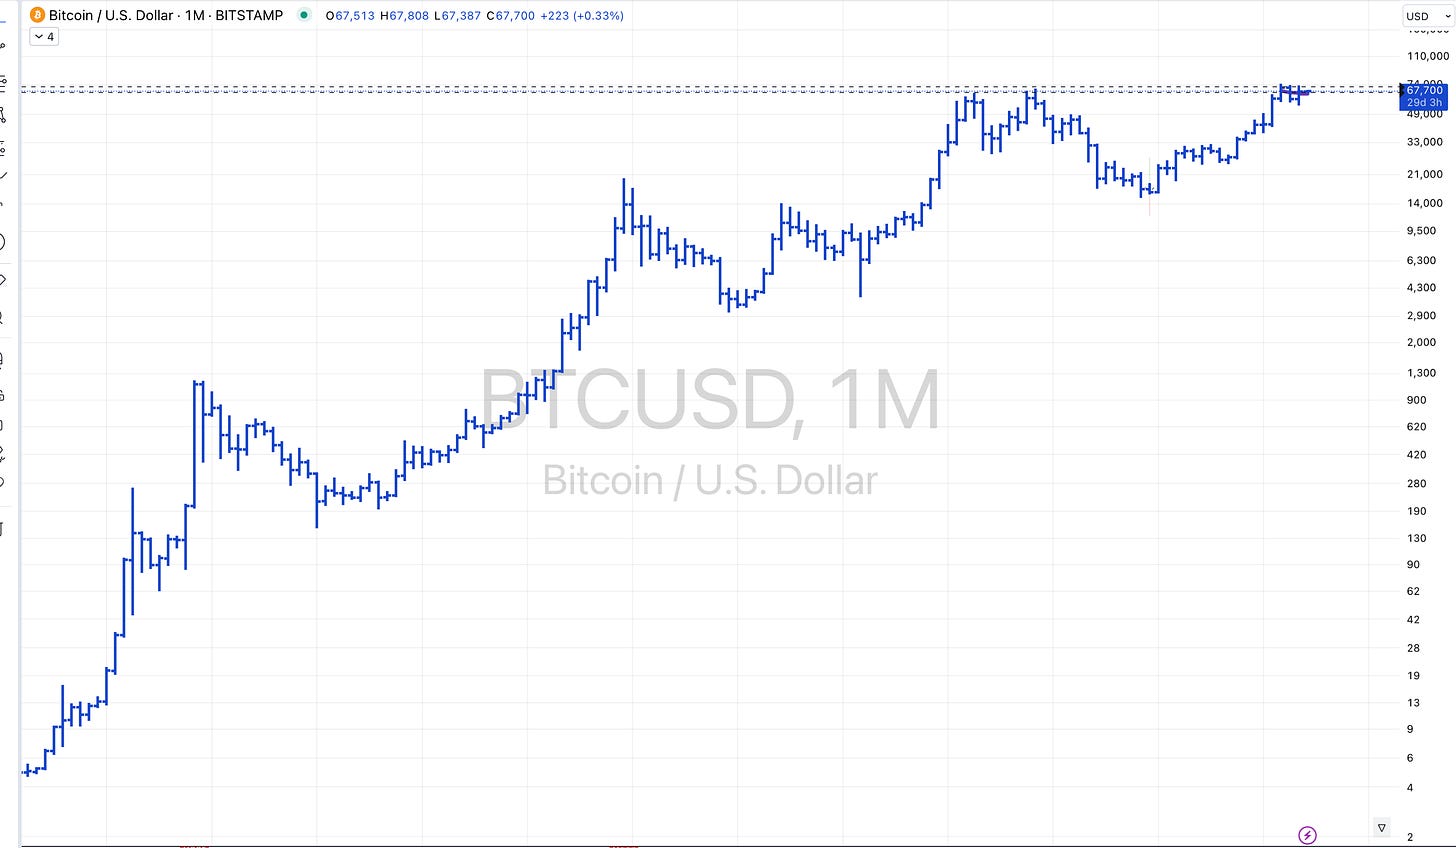
Analyzing the Charts: We'll start with the crypto market, focusing on Bitcoin and Ethereum due to their significant movements. While Ethereum approaches all-time highs, it hasn't quite reached them yet, unlike Bitcoin, which has recently surpassed its previous highs. This analysis is pivotal as it shows the relative strength and potential bull flags forming in Bitcoin's chart.
In contrast, other major cryptocurrencies like Cardano, Litecoin, and Ripple are struggling to reach their all-time highs, indicating a lack of participation in the broader rally. This selective performance suggests a focused strategy on stronger assets like Bitcoin and Ethereum for potential bullish trades, while considering shorts on underperformers if the market turns.
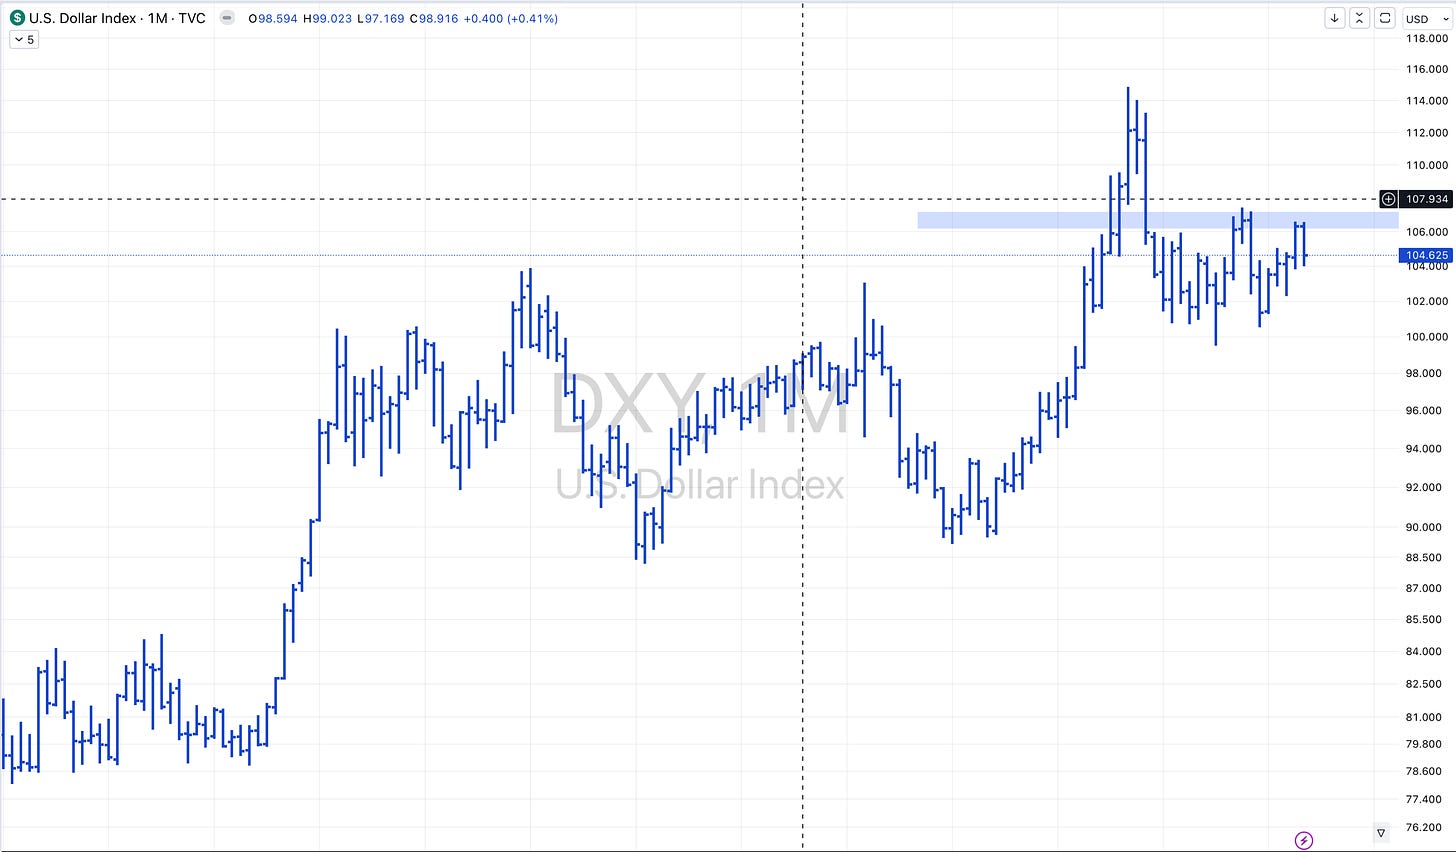
The Dollar and Forex Analysis: Shifting our focus to the Forex market, particularly the DXY, we've seen a significant reversal at a key level we've been monitoring. The monthly chart shows a clean reversal, and while the weekly chart indicates an inside week with little movement, there's potential for further downside, testing lower support levels
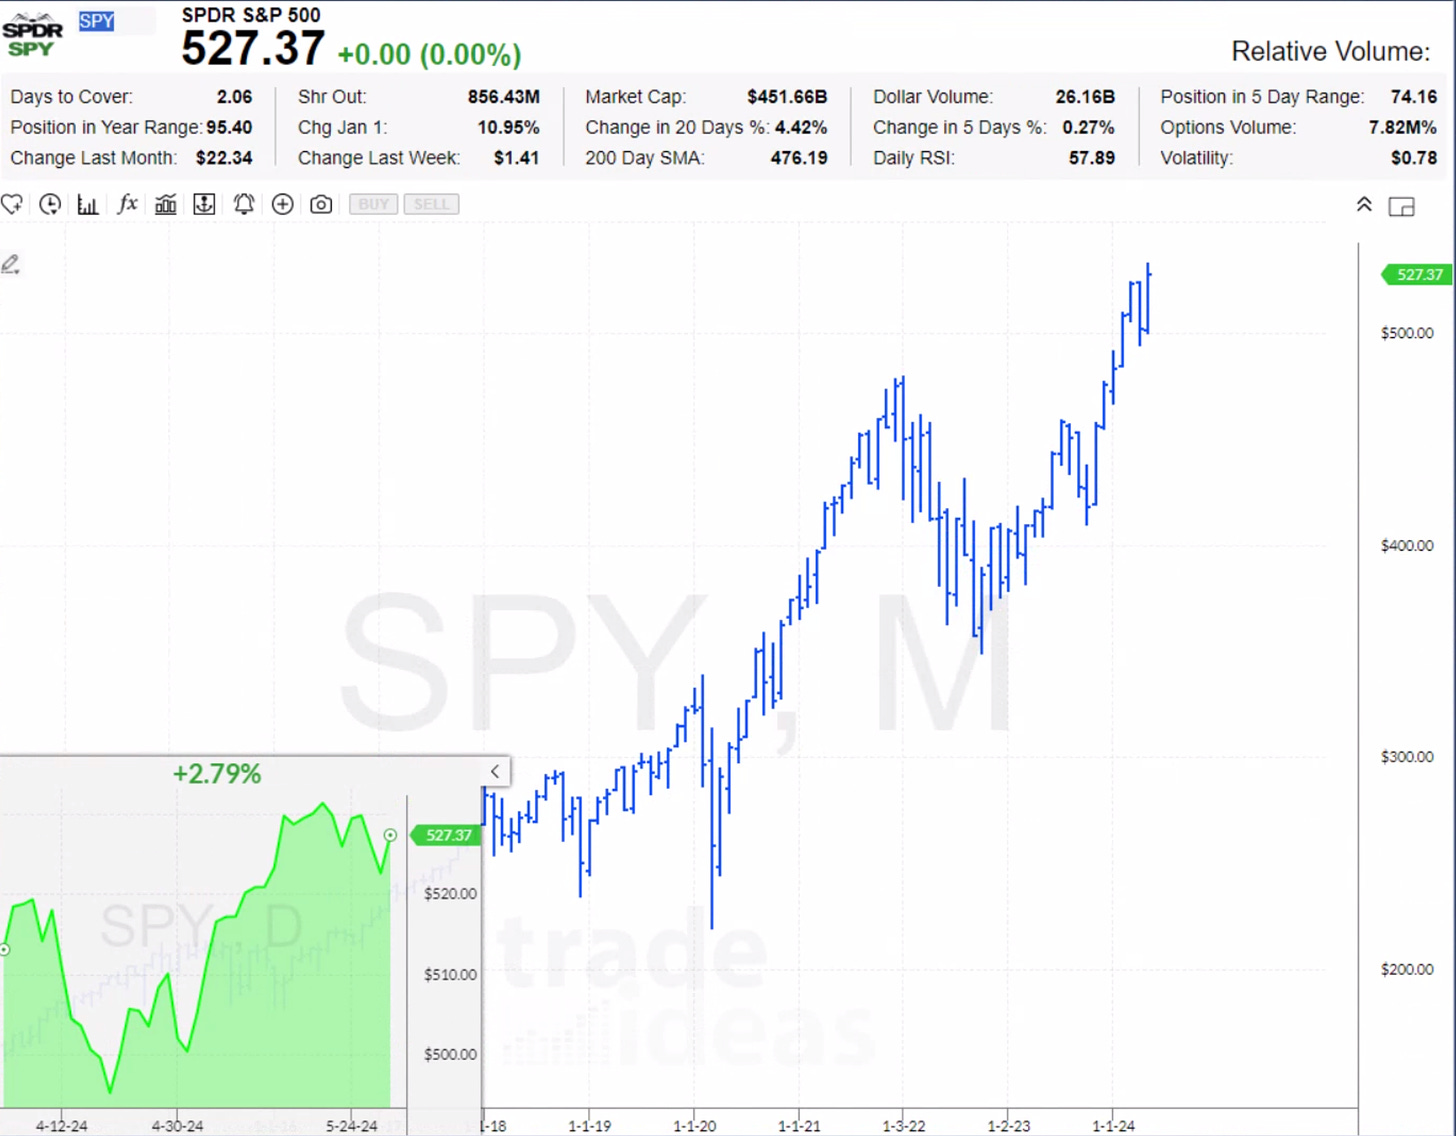
Stock Market Overview: In the stock market, we'll compare the SPY (S&P 500 ETF) and the Dow. Both have shown significant volatility with a notable bottoming tail in SPY, suggesting a potential bear trap scenario where shorts might get squeezed if the market rebounds. This is contrasted with the Dow, which still faces overhead resistance despite a strong bounce.
Sector and Individual Stock Highlights:
Energy Sector: XLE has shown strength, particularly on Friday, bouncing off significant levels. This strength could be an indicator of more robust performance in the energy sector.
Tech and Growth Stocks: Contrastingly, ARK ETFs, which focus on high-growth tech stocks, have underperformed, suggesting that the market currently favors more value-oriented, profitable companies, like those Berkshire Hathaway invests in.
Conclusion: As we wrap up, I'll be monitoring these developments closely and adjusting strategies accordingly. The insights from both the monthly and weekly charts provide a comprehensive view that helps in making informed trading decisions.


