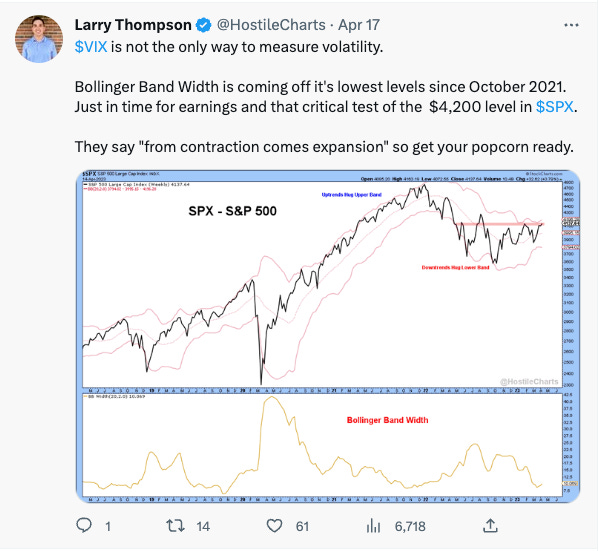
This topic was inspired by my buddy Larry Thompson and the tweet below. Check him out.
As someone who writes scans and systems to help refine my trading, I am always searching for the next idea to make my trading better and more straightforward. Larry’s tweet (posted above) was that kick-start to refine a current system I have used for a long time.
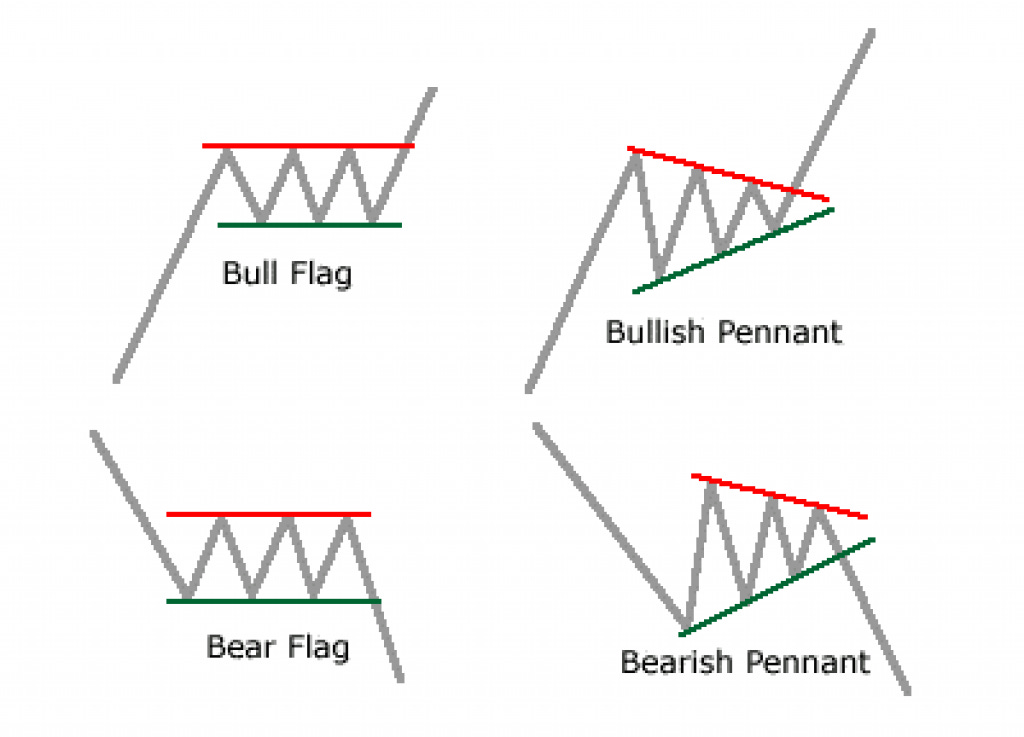
The “flag pattern” is one of the most popular patterns. It is used by new and experienced traders alike. It combines all the essential parts of technical analysis we are taught: trend, volatility and support/resistance.
We know two things about price, price trends and volatility mean reverts. This has been proven academically and can easily be seen on a chart. Let’s look at price trending on a monthly chart of the S&P 500, where we can see long periods of price trends. If that market were random, we would not see this.
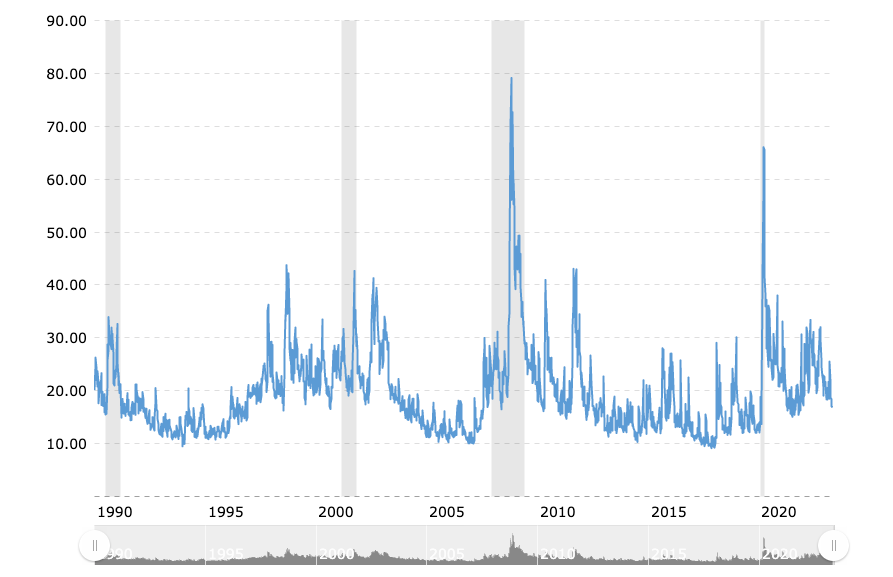
Now let’s focus on volatility mean reverting. Below is a chart of the $VIX. The VIX tracks the fear in the market and is used as a proxy for how much volatility is occurring in the market. Notice the mean reverting nature of the chart. Periods of high volatility preseed periods of low and vice versa.
So if we agree with the above ideas, it could simplify a trading plan.
Wait for something trending to have low volatility
Take a position in the direction of the trend
Wait for the expansion of volatility in the direction of the trend.
This explains the popularity of the flag patterns, as it covers all of the above points in a very discretionary way.
But what about system traders? Those of us who use systems to trade or to find the next names to research for trades or investments. Programming technical patterns into a system is complex since these patterns are subjective. This means we need to figure out a way to quantify the essential parts of the flag.
Trend: This one is simple and has several ways to do it. We can look at the slope of a moving average or price (check out my substack Slope Matters here). We could also seek out stocks near a period high.
Volatility: Larry mentioned Bollinger Band width in his tweet. The Bollinger bands use the standard deviation of prices to help us detect how much a stock varies from its average. So the lower the distance between these bands, the less current volatility you see in the name.
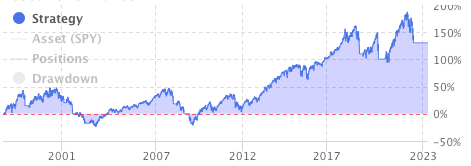
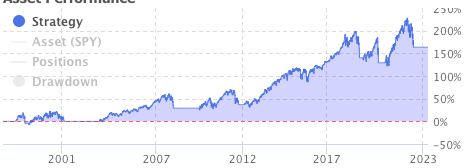
Combining trend and volatility, we can look to build and test a simple system to find stocks to trade in this “bull flag” style. In the system below, we buy the S&P 500 when the Bollinger bands are tight and the price breaks higher. This system gets us in as the price increases and keeps us out of significant drawdowns.
Adding the 200-day moving average sloping higher as we did in the slope matters substack (here), we see a boosted return. More importantly, we do a much better job of sitting out of bear markets like in 2001 and 2008.
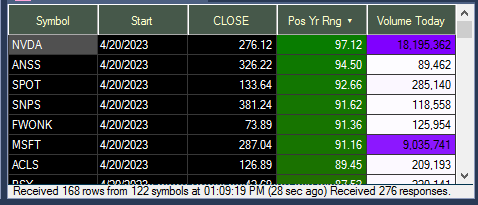
This is how trading systems are created. We started with an idea and then tested it to ensure there was an edge, and now we need to make sure we can find stocks that are set up like this in real-time. This is where trade-ideas comes in (check it out here and use StatsEdge for 15% off). With their new market explorer engine, I built the system above to be scanned for in real-time across all stocks.
Here are the requirements for the scan.
The stock trades, on average, at least 250,000 shares a day to ensure it’s liquid enough to trade.
The Bollinger bands are the tightest they have been in a year.
Sort that list by how close they are to their 52k week highs
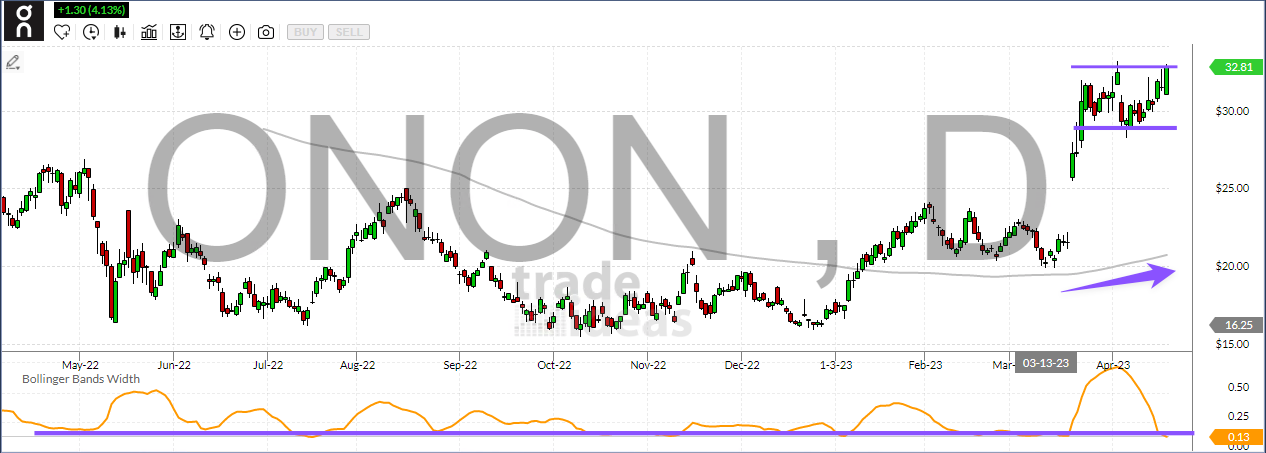
The output of this scan seems to give us what we are after. Look at ONON below. The orange line at the bottom shows us the width between the bands. We can see they are as low as they have been in a long time showing the decrease in volatility.
Sorting by position in the 52-week range, we will naturally get stocks that have been moving up for some time so that we will have upward slopes in most moving averages.
My trading plan for these will be simple. Look for a strong breakout after the volatility contraction in the direction of the underlying trend. Position sizing and profit-taking are the next questions when building a strategy like this, but we will leave that to future writings. Make sure you subscribe not to miss it!
Michael Nauss CMT


