Welcome back to Technical Thursdays, where we analyze key market levels and setups to give you actionable insights. Today, we’re revisiting one of my favorite setups: a strong resistance level that breaks, followed by a retest and potential continuation. This setup is simple, effective, and easy to manage, which is why I use it often.
S&P 500:
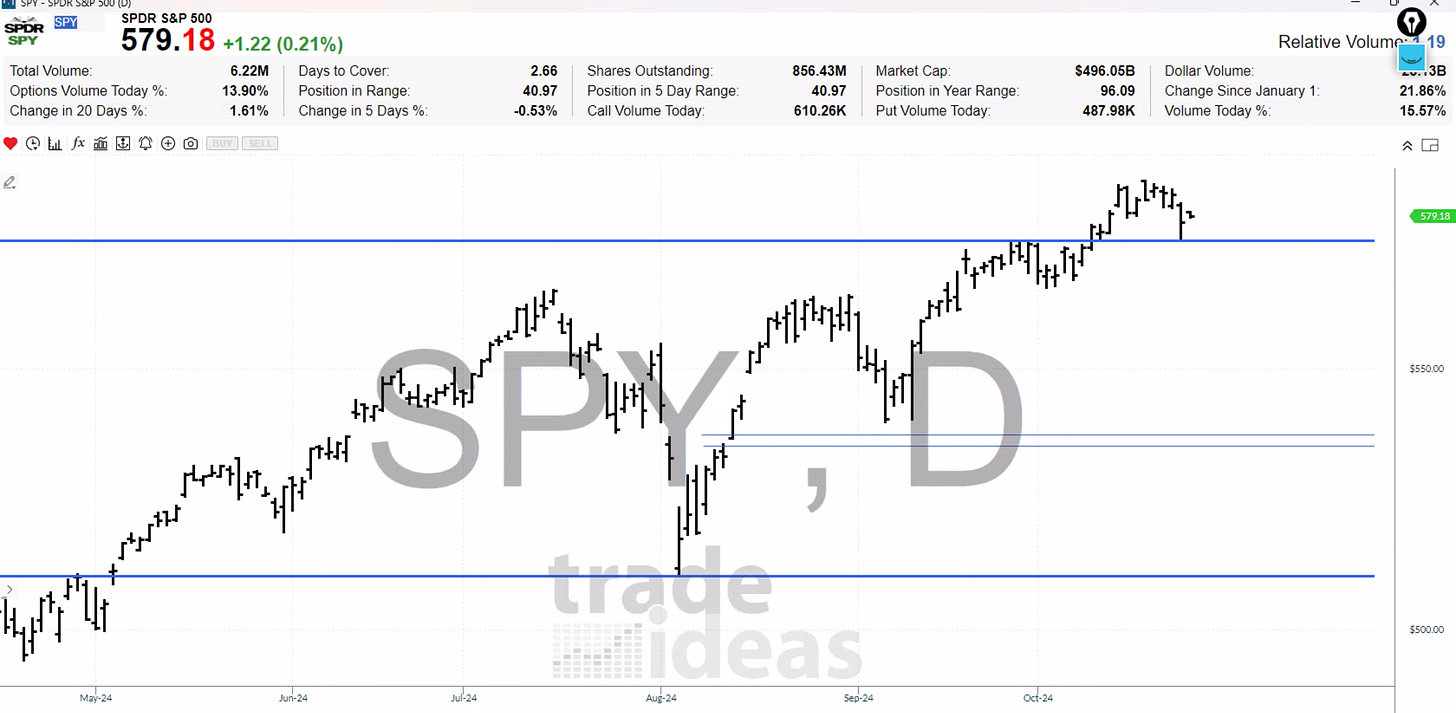
We’ve recently seen the S&P 500 break through prior resistance, retesting that same level around 574-575. This "stair-step" pattern, where each retest after a breakout holds, signals that those who missed the breakout are jumping back in when prices pull back to those levels. If we see yesterday’s low hold, it’s a sign that the bulls are still in control. However, if that low is violated, it’s time to consider getting defensive.
SMR: A Pullback Opportunity
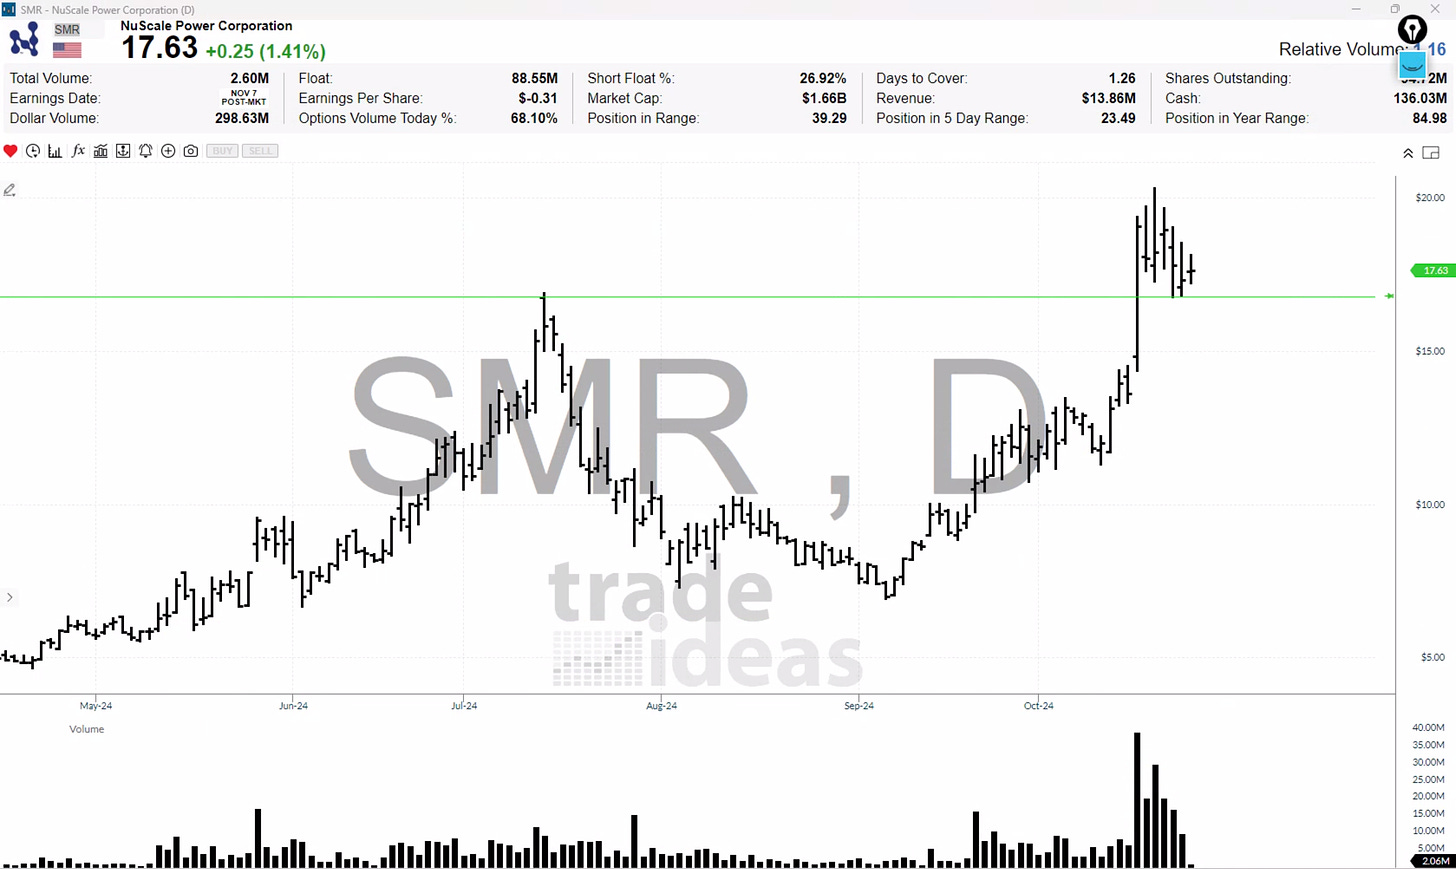
I’ve also been watching SMR, which has come up on one of the StatsEdge Pro pullback algorithms. After a huge "igniting day" that pushed through resistance, we’re seeing a pullback into that previous breakout zone. I originally placed a stop below the prior low, but I’ve now adjusted it to a tighter stop around the recent low, reducing my risk. If the price bounces from here, I’ll stay in; otherwise, I’ll move on quickly
.
The key to both setups is understanding that FOMO—fear of missing out—often drives these pullbacks. Traders who missed the initial breakout often place buy orders at previous highs, providing support for a potential move higher.
Key Takeaways:
S&P 500: Watch the 574-575 area for a bounce or breakdown.
SMR: Look for support around 18.50-19.00 following a pullback to its prior breakout level.
Keep It Simple: Focus on key resistance and support levels and use basic technical analysis to enhance your edge.
For more setups like these, check out StatsEdge Pro, where we combine backtested algorithms with simple technical analysis for smarter trading decisions.


