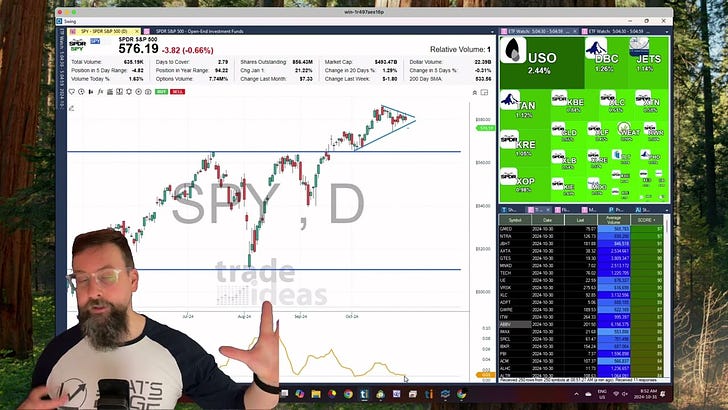
Welcome to Technical Thursday! Today, I’m diving into a critical concept in technical analysis: volatility contraction and how it helps in identifying potential breakout opportunities. Many traders get caught up in defining specific patterns (e.g., flags or pennants), but I want to show you how a focus on contracting volatility provides clear signals, independent of pattern names.
What is Volatility Contraction?
Volatility contraction refers to the tightening of price movements over time, which often indicates that a breakout (up or down) is imminent. When price action becomes compressed, buyers and sellers reach a balance, suggesting a potential surge in volatility soon.
Using Bollinger Bands to Track Volatility
One tool to help visualize this is Bollinger Bands. These measure price relative to a moving average and adjust their width based on volatility. Narrower bands signify low volatility, while wider bands indicate high volatility.
For simplicity, I recommend using the Bollinger Band Width Indicator, which shows band width as a separate line. When this line contracts significantly, it indicates low volatility and suggests a breakout could be near.
Practical Example: EVR Trade
A recent example is a setup on EVR, identified by our mean reversion algorithm. As volatility contracted, our Discord alert bot sent out a notification at a key entry level. Watching the Bollinger Band Width Indicator, I entered the trade as the band width began expanding—showing a resurgence in volatility—resulting in a successful trade.
If you’re a mean reversion trader, seek tight volatility signals before price reverses. If you’re a trend continuation trader, focus on low volatility zones as potential breakout points.
Want to explore more strategies with high-probability setups? Check out StatsEdge Pro at StatsEdgeTrading.com.
Use Bollinger Bands to spot volatility contractions and catch those breakout moments!


