Discovering TAN: A Solar ETF on the Rise
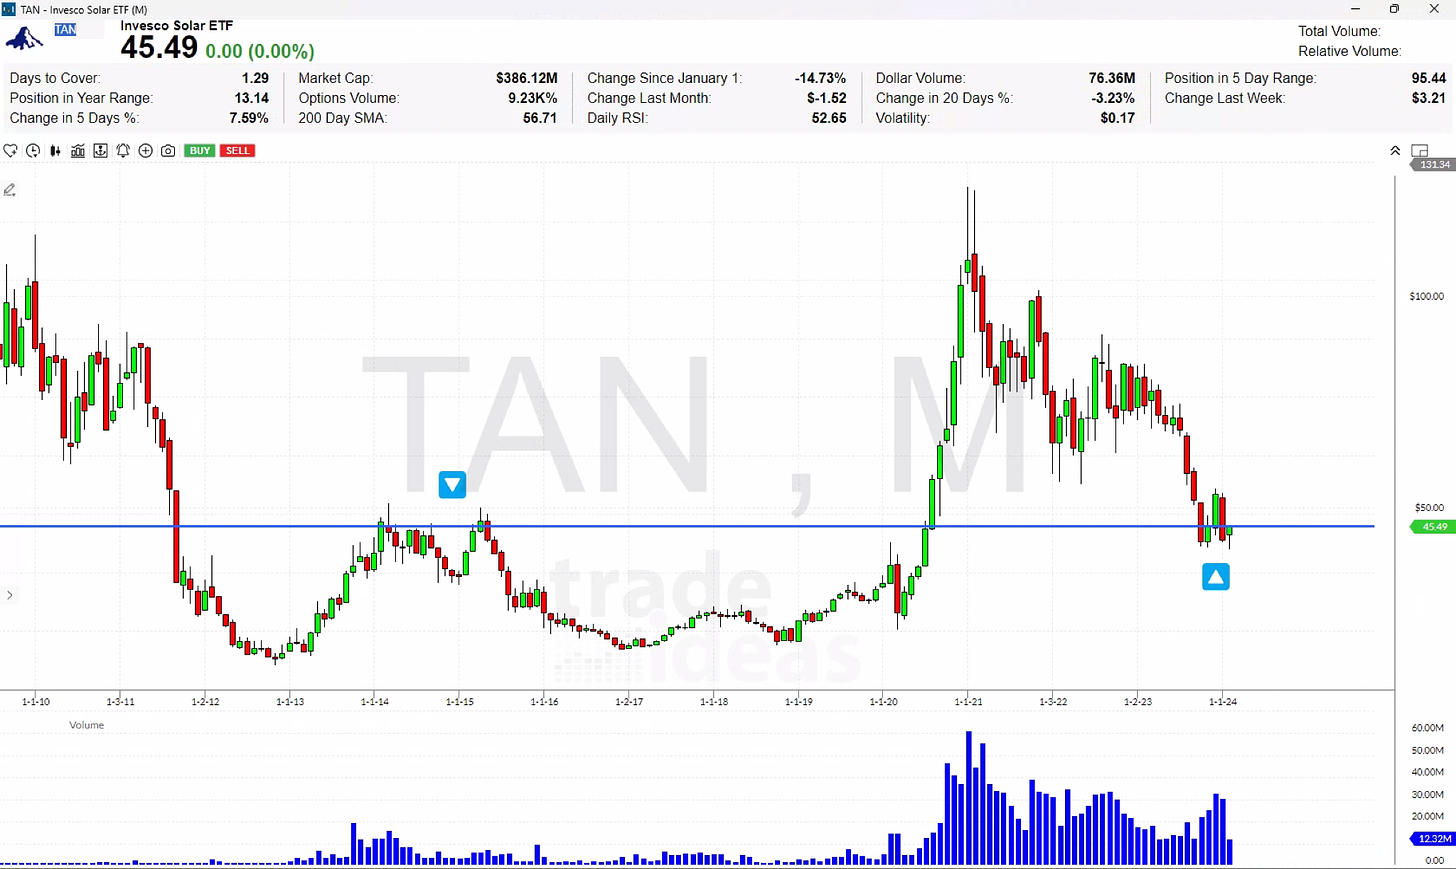
My journey into the solar sector began with an examination of relative strength across all sectors, where TAN stood out due to its performance within its five and ten-day ranges. A glance at the monthly charts revealed a significant drop from 130 to 45, positioning it at a pivotal area that historically acted as a bounce point, not once but twice.
Technical Insights: The MACD and Price Trends
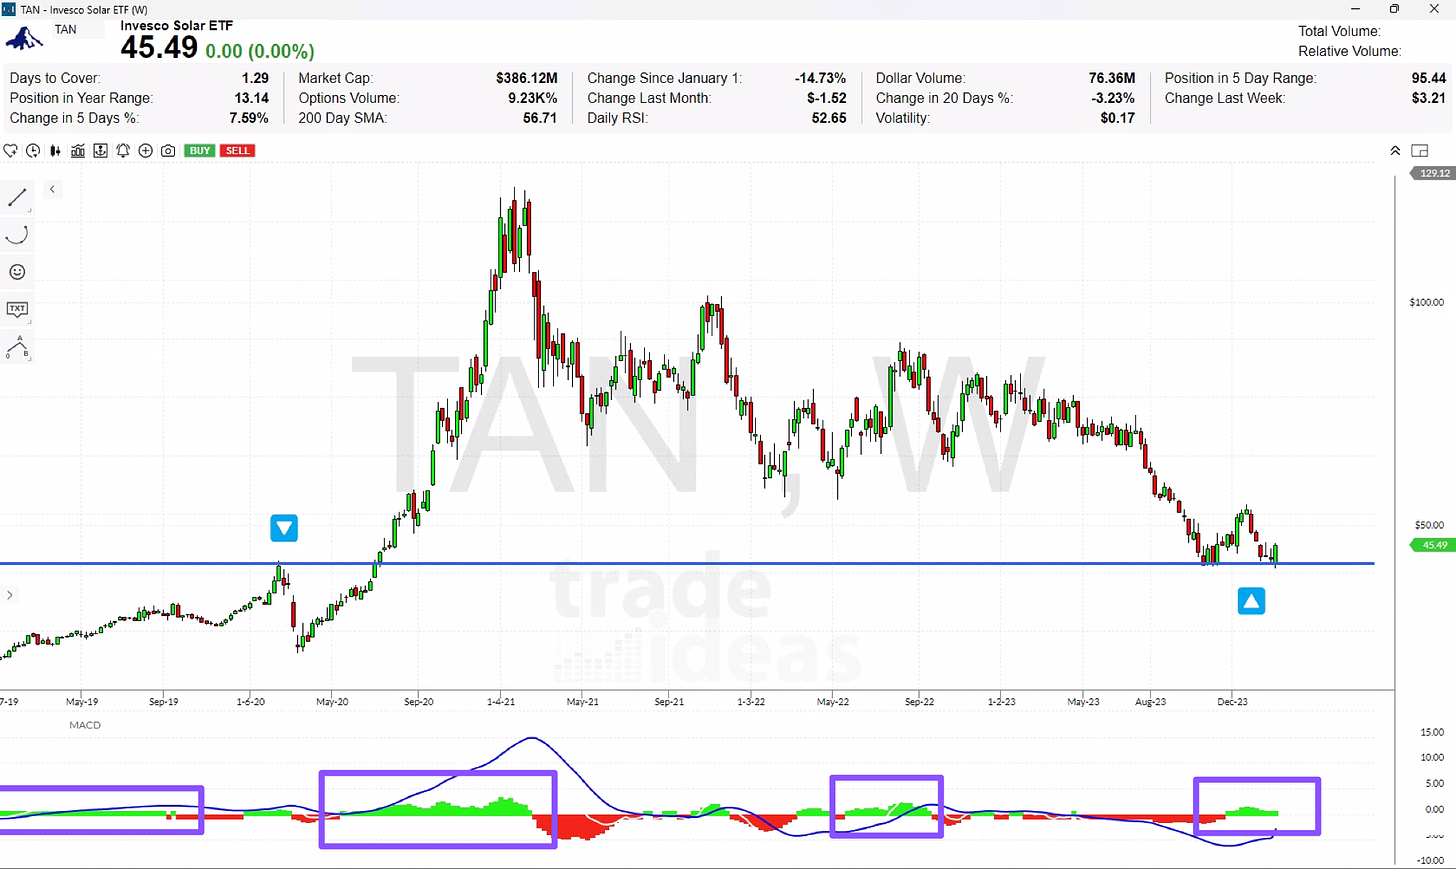
Spending time on the MACD indicator on the weekly chart, a pattern emerged showing sustained trends whenever the MACD turned green. TAN appears to be a trend-driven ETF, swinging between periods of favor and disfavor. Additionally, a pivotal moment in 2020 caught my attention, where TAN is currently hovering around a significant level, suggesting potential momentum.
The last four weeks showed a sideways movement breaking a prior low, only to rally significantly—a pattern I find particularly promising for trading opportunities. This behavior, coupled with a break and close above the anchored VWAP, signals a strong position above the $40 mark, hinting at a short-term floor.
Spotlight on RUN: A High Short Interest Play
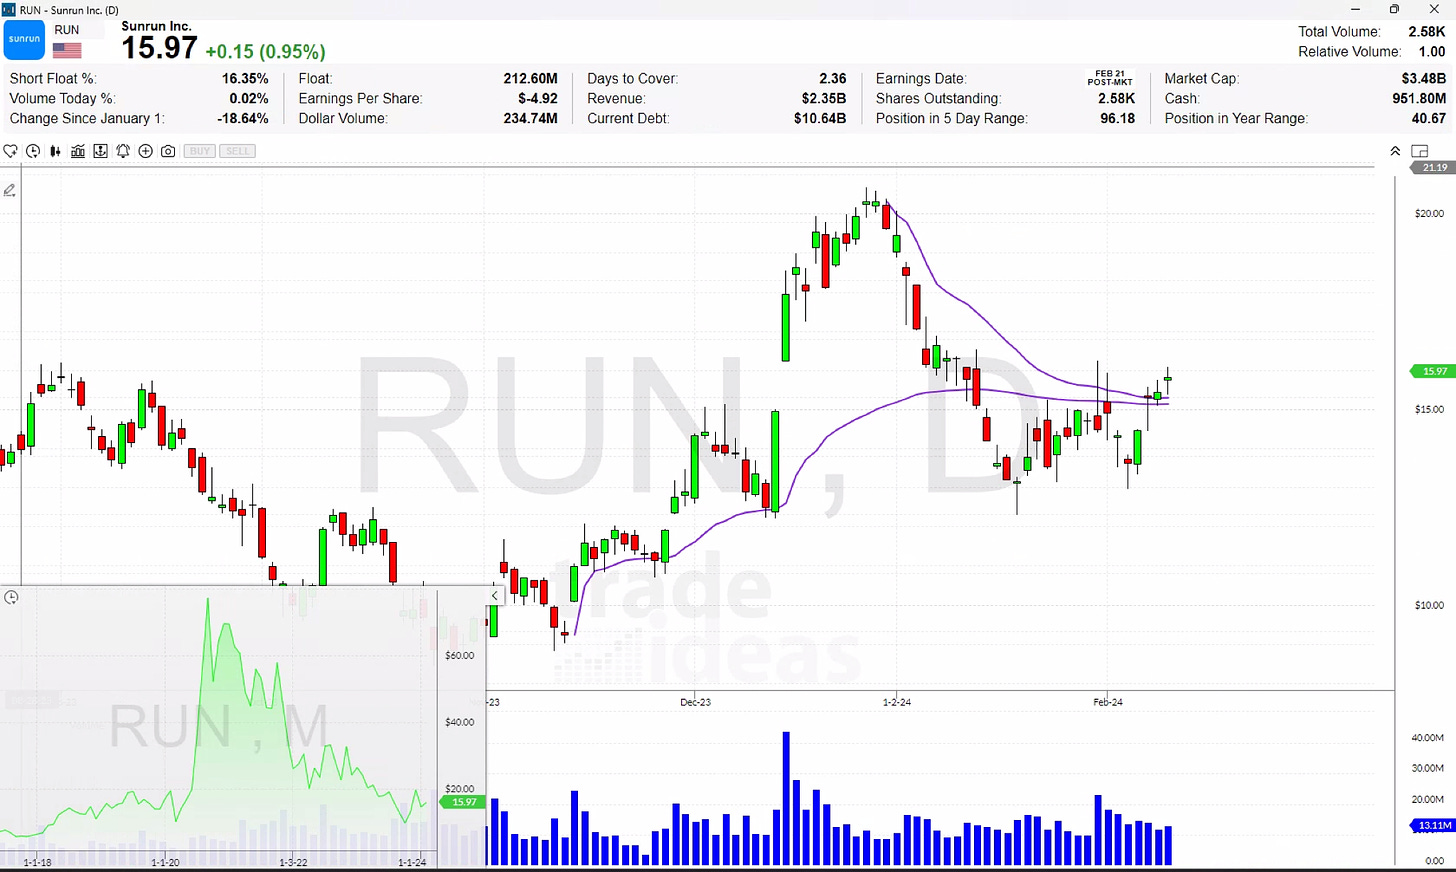
Within the solar sector, RUN stands out with a 16% short float, indicating a substantial bearish bet against it. However, its recent break above both the high and low anchored VWAPs suggests potential for upward movement. This scenario presents an exciting opportunity for traders looking for volatility and potential short squeezes.


