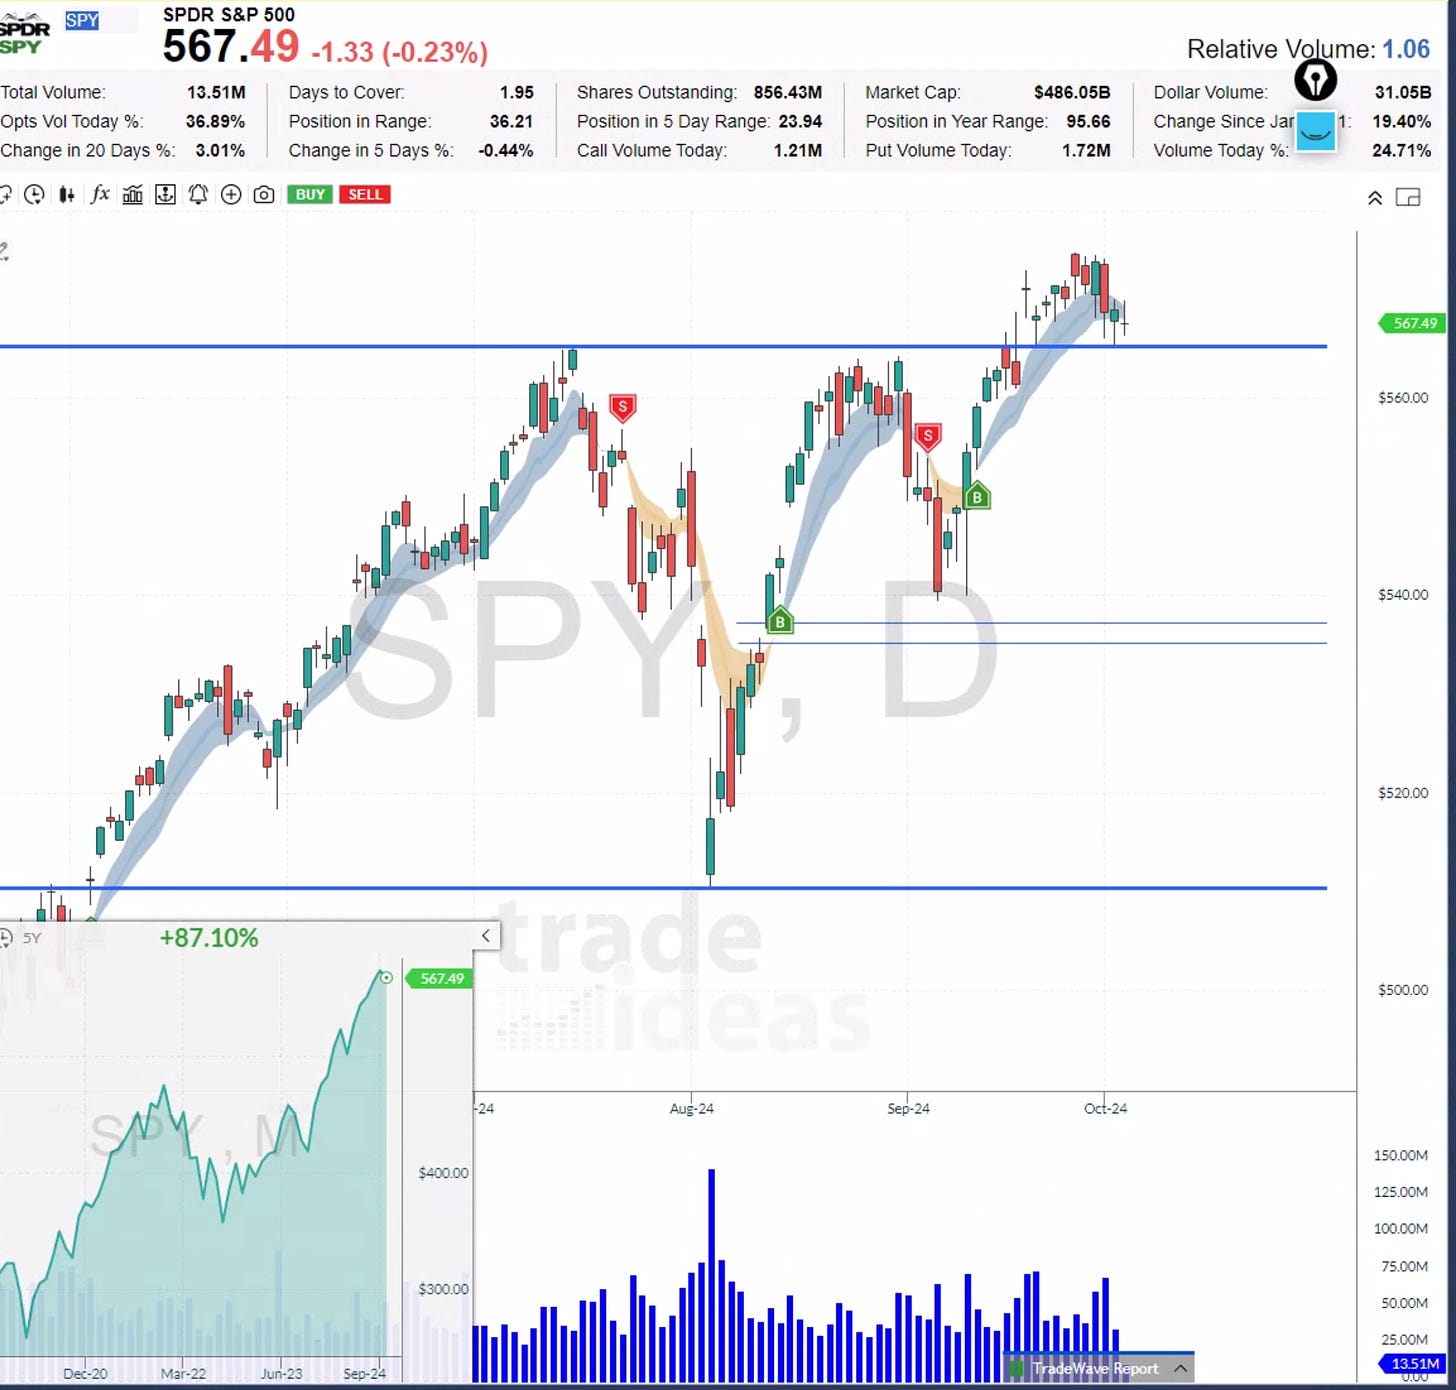
Welcome back to Technical Thursdays, where we focus purely on chart patterns and analysis. Today’s topic is polarity—the idea that prior support becomes future resistance (and vice versa). This simple yet powerful concept can be applied to any time frame and asset class, whether you're trading stocks, crypto, or forex.
What is Polarity?
Polarity is a basic technical principle where a price level that acted as support now becomes resistance after the price breaks below it. This also works in reverse—a resistance level can become support once broken to the upside.
The psychology behind this concept is tied to FOMO (fear of missing out) and regret. Buyers who missed a breakout are eager to jump in when the price revisits that level, while short sellers hope to exit their losing positions at break-even.
Real-Life Application
Looking at the S&P 500 (SPY), we see a perfect example of polarity. After a significant breakout, the price revisited a previous resistance zone. This is where buyers who missed the move enter the market, while short sellers cover their positions, resulting in a bounce.
The beauty of polarity lies in its simplicity:
You trade with the trend.
You have a clear risk-reward setup.
The market already respects the level, giving you a psychological edge.
Key Takeaways:
Polarity works across all time frames and securities.
It offers a clear risk-reward ratio—if the level holds, you ride the trend; if it doesn’t, you cut losses quickly.
It taps into the psychology of buyers and sellers, making it one of the most reliable technical setups.
For more systematic trading strategies and educational content, head over to StatsEdgeTrading.com. You’ll get access to strategies like this and join a community of traders who leverage both systematic and discretionary approaches.


