Part of Stats Edge Pro includes a monthly rotation strategy where an algorithm selects the top five symbols to invest in for the upcoming month. This strategy has performed exceptionally well, delivering a 40% return last year and the same percentage gain this year. If you want to learn more, visit Stats Edge Trading. Now, let's dive into the charts!
Bitcoin Analysis
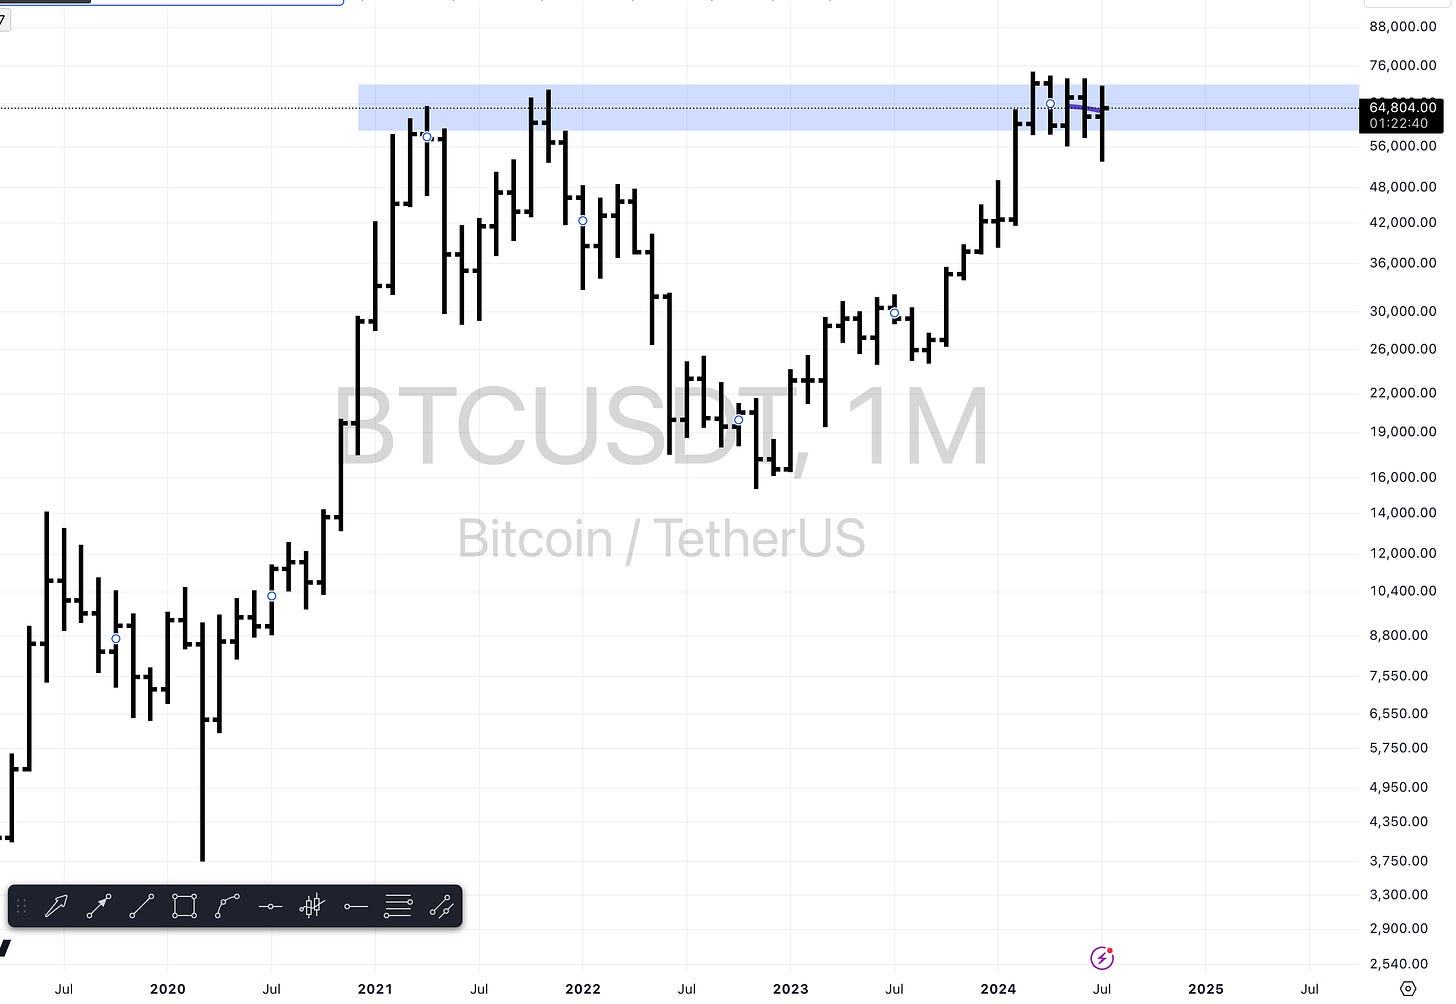
Starting with Bitcoin, we saw an interesting development. The monthly candlestick initially looked grim but recovered, forming a consolidation pattern that resembles a bull flag. If we break out from this range, the coveted 100K target might be within reach. However, we're still below all-time highs, so a few more months of sideways action wouldn't be surprising.
Ethereum shows a similar pattern, though not as strong as Bitcoin's. It remains in consolidation mode, waiting for a definitive move.
Gold and Silver
Gold attempted to break out above prior highs but faced resistance, forming a topping tail. While the overall trend remains positive, short-term caution is advised as it may need more time to digest recent gains.
Silver, on the other hand, managed to close above its resistance level on the monthly chart, showing a stronger setup. The pullback and subsequent breakout suggest a potential for further gains.
Dollar and Forex
The US Dollar Index (DXY) remains in a sideways consolidation. It's important to note the significant support and resistance levels, as any break could signal a substantial move.
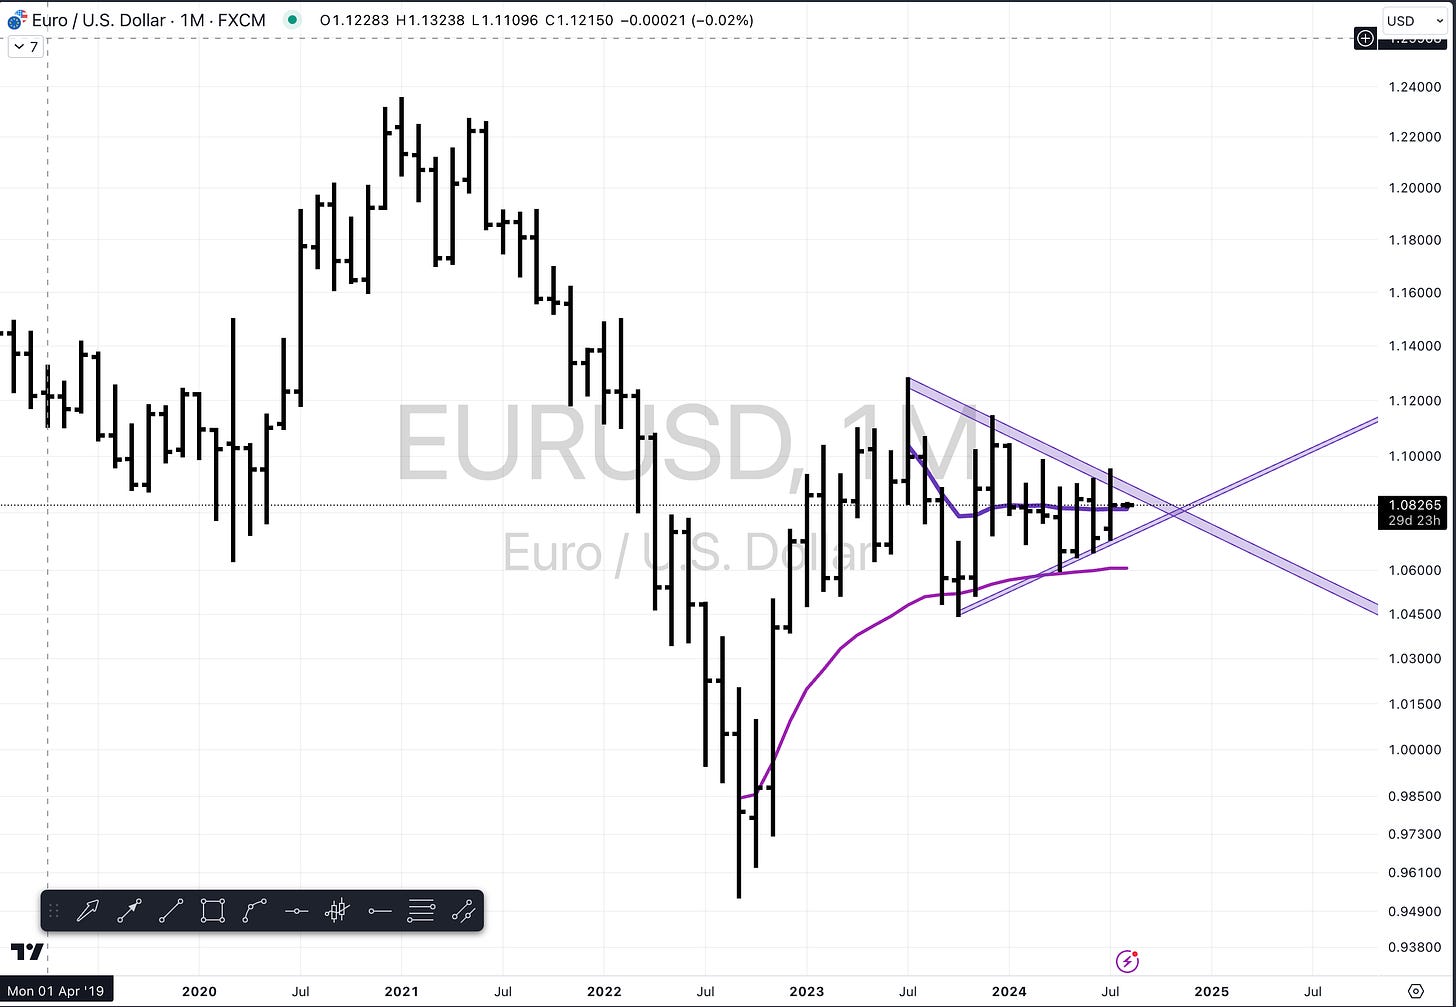
The Euro is getting tighter, indicating a potential for range expansion soon. Aussie CAD forms a potential rising wedge, suggesting another leg down if the lower trendline breaks. Similarly, Aussie New Zealand Dollar faces a possible failed breakout, worth watching closely.
USD JPY saw a significant move due to the Bank of Japan's intervention. The 152 level is crucial; a failure to break higher might offer a shorting opportunity.
Stock Market
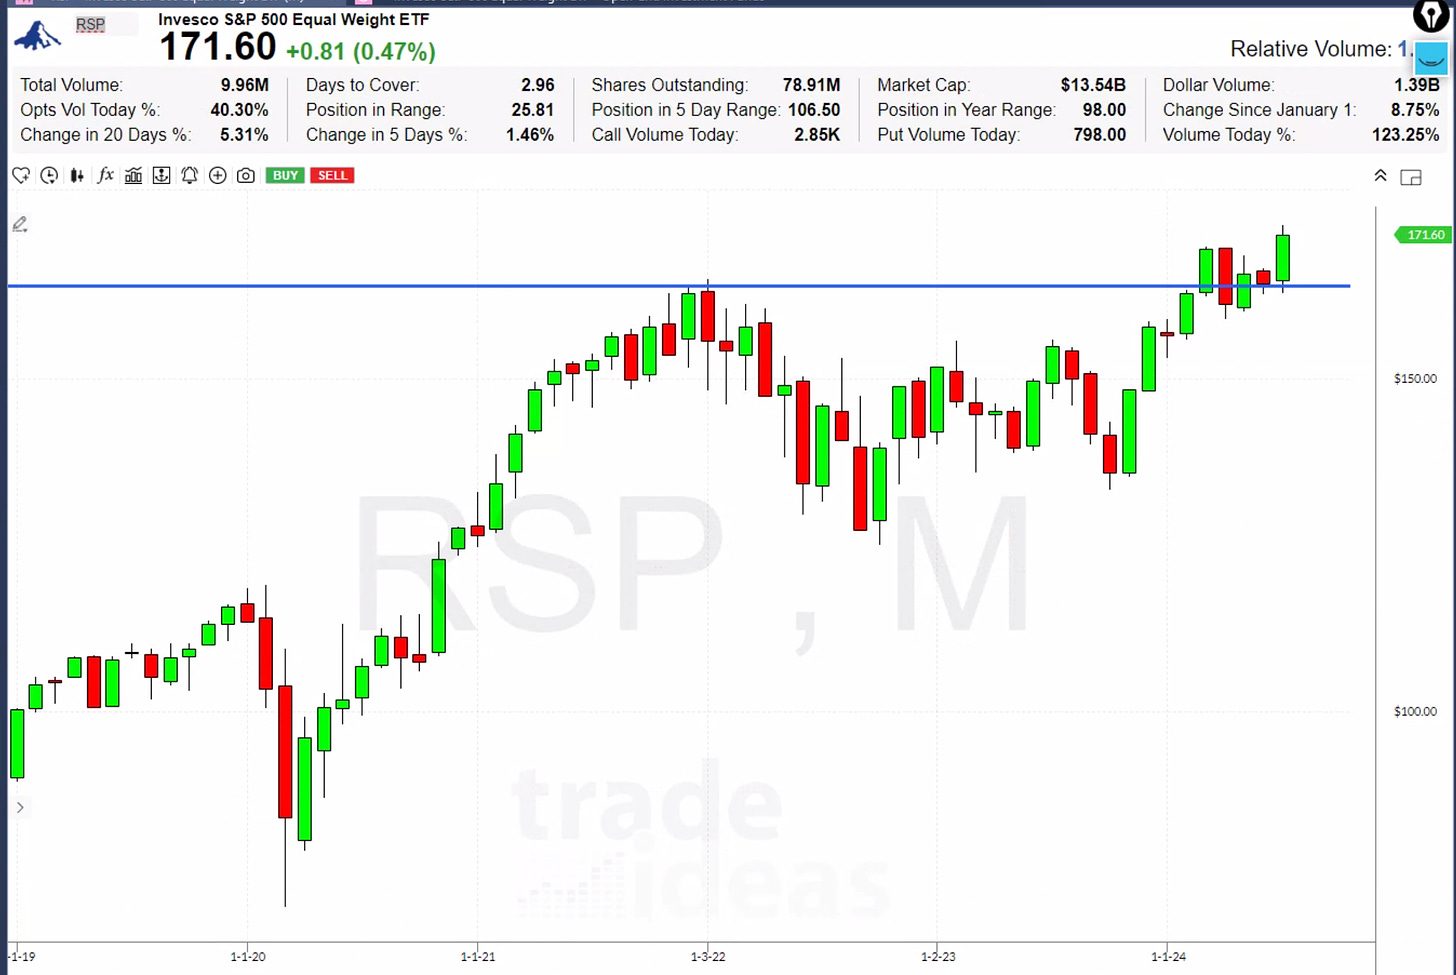
Using Trade Ideas, we analyze the SPY monthly chart. Despite a recent rally, the SPY shows a topping tail, hinting at potential short-term weakness. In contrast, the RSP (equal-weighted S&P 500) looks more robust, indicating strength in the broader market beyond large-cap tech.
The MDY (mid-cap index) and IWM (small-cap index) show solid breakouts, highlighting a rotation into smaller-cap stocks. This rotation from large-cap tech to other sectors is a bullish signal for the broader market.
Sector Review
Uranium: Strong move up 4.5%, bouncing off key support.
SMH (Semiconductors): Showing profit-taking.
XLE (Energy): Holding above an ascending triangle, looks poised for further gains.
TAN (Solar): Holding support, needs a push above resistance.
XLV (Healthcare): Breaking out, showing strength.
XLB (Materials): Bull flag formation, bullish outlook.
KIE (Insurance): Breaking out on strong volume.
IBB (Biotech): Breaking out, strong setup.
XLI (Industrials): Another sector showing a breakout.
Except for semiconductors, all sectors look strong, indicating a healthy rotation within the market.
Conclusion
The monthly analysis shows a robust market with significant rotation from large-cap tech to smaller-cap and other sectors. This rotation supports a bullish outlook, with many sectors breaking out and showing strength.
For more detailed analysis and access to my algorithms, visit Stats Edge Trading. If you're a StatsEdge Pro member, check your email for the latest updates and monthly rotation strategies. Until next time, enjoy the markets and take some time away from the screens.


