At some point in our trading career, we have looked at some indicator that will tell us when the market is “oversold” and “overbought.” The premise is simple. When the market is “down too much” you buy and when it’s “up too much” you sell.
If only life was that simple.
Why bring this up now? The small cap index has been ripping recently. Perma bears have gone from crying that the market was being driven only by 7 stocks to now complaining that the small-cap index IWM 0.00%↑ is overbought and that is the new reason that the market is going to go lower.
The thing I love about the market and why I trade first with statistics and only with charts after is we can prove some things.
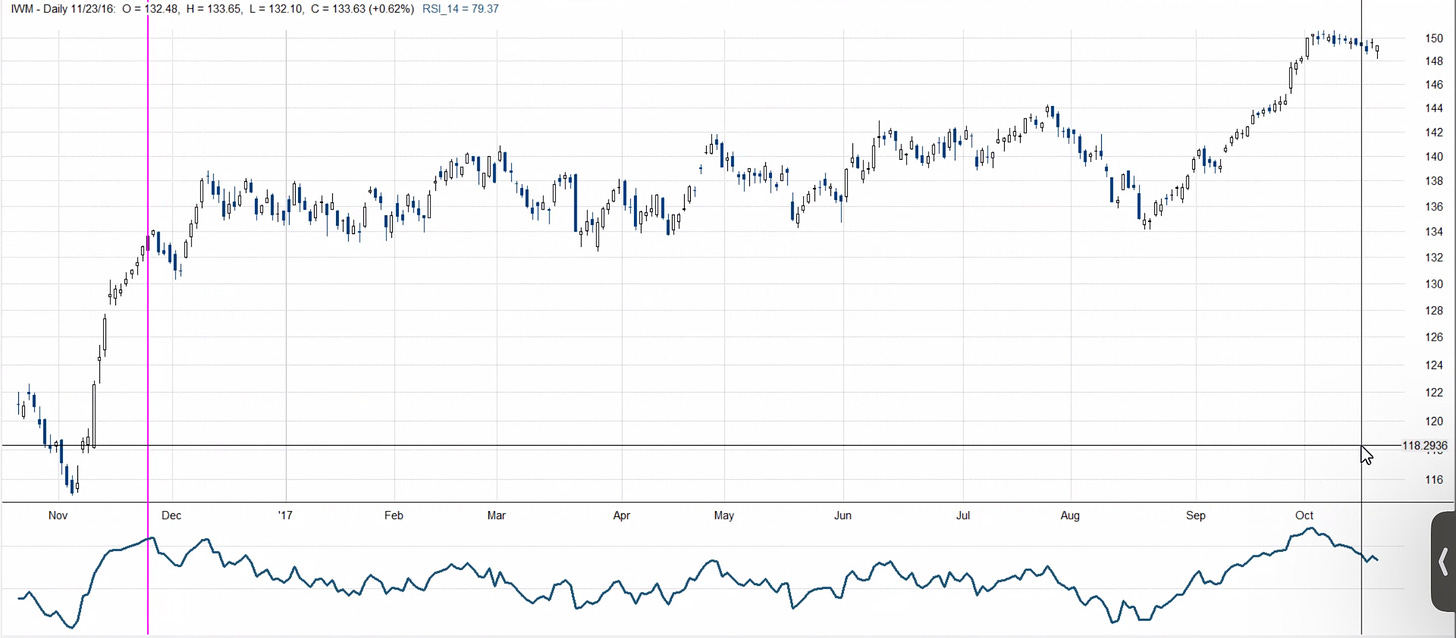
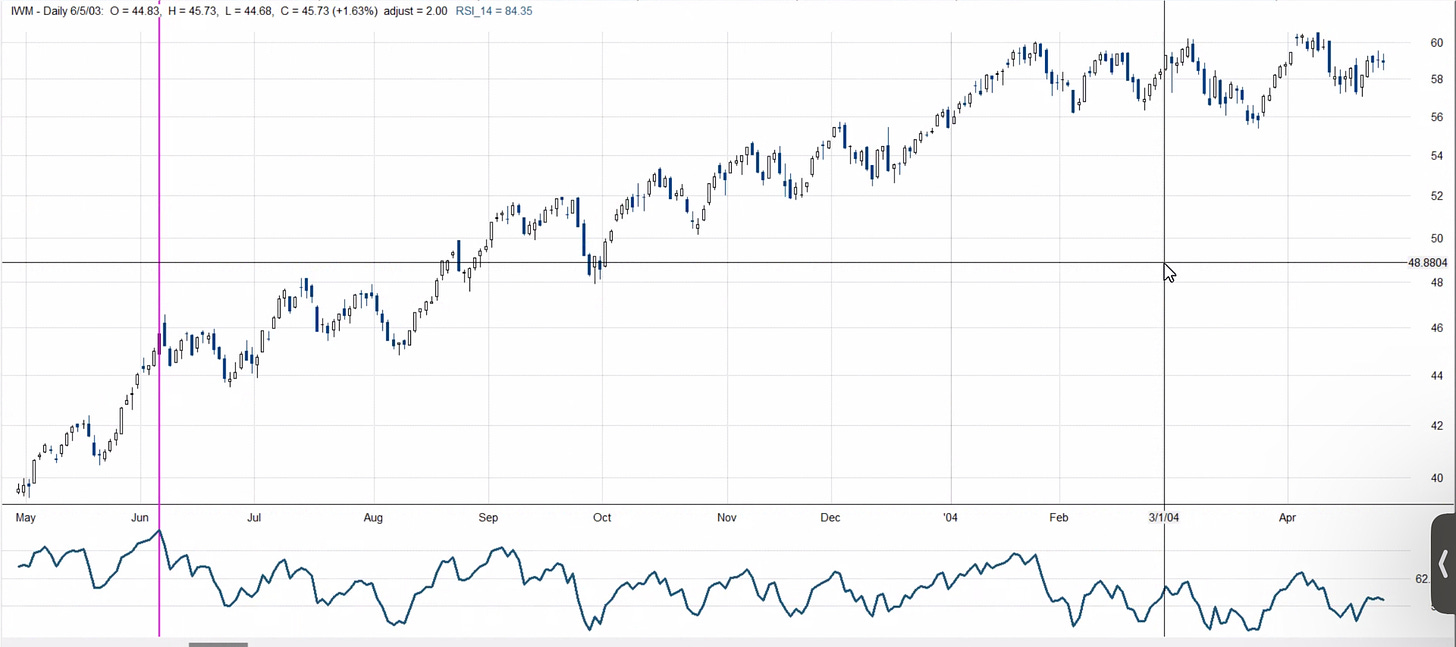
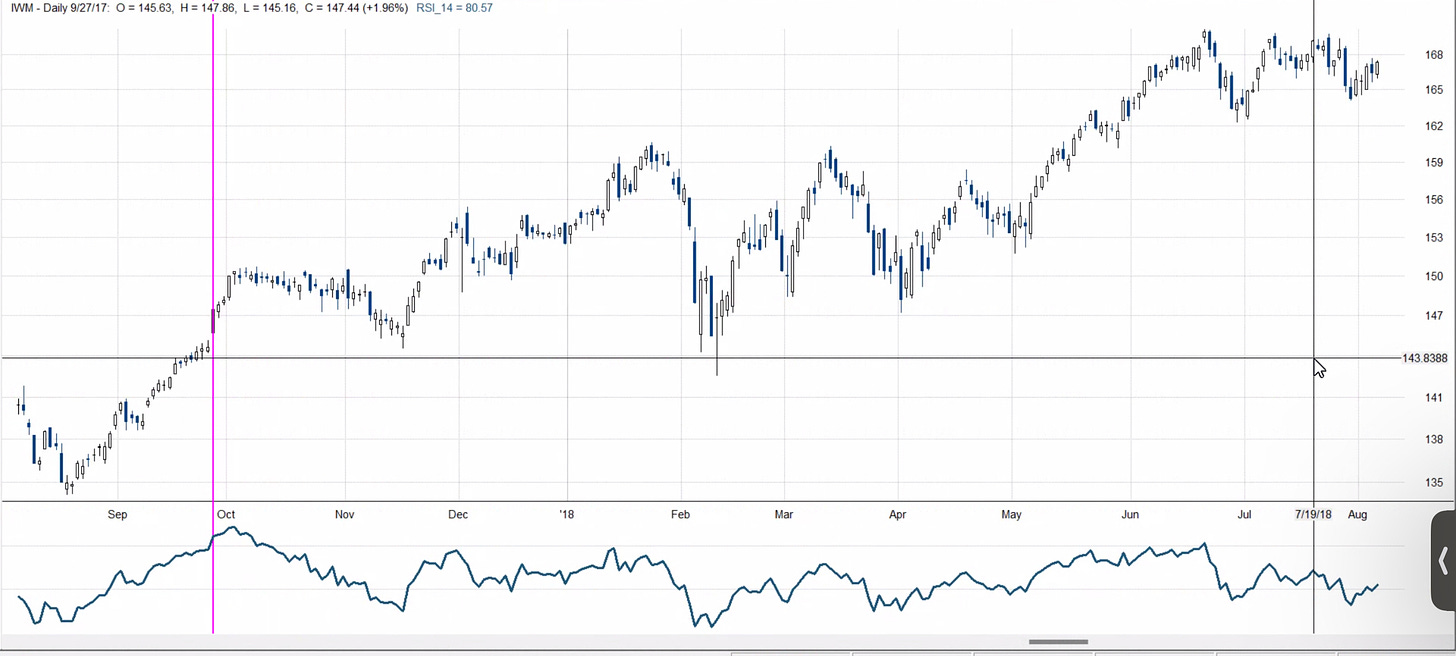
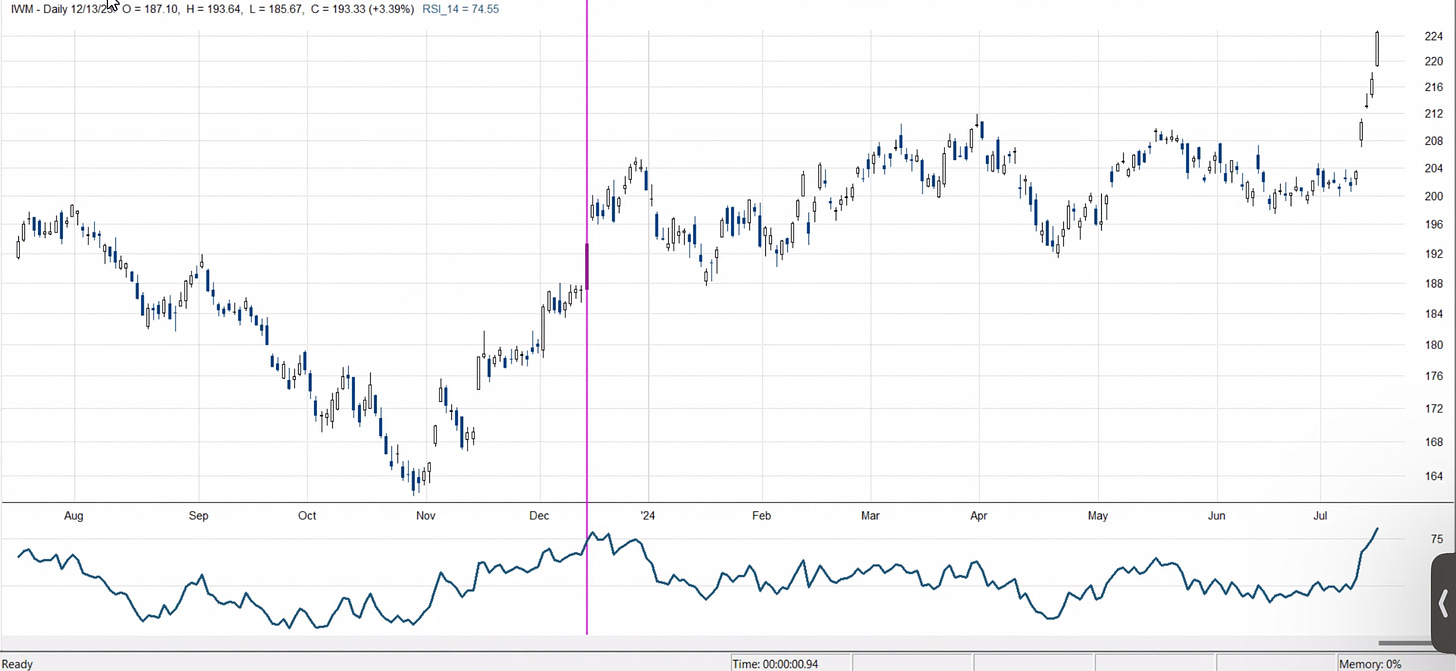
The IWM 0.00%↑ RSI (most common overbought/oversold indicator) hit an extreme overbought reading of 80 2 days ago. Let’s take a look at the other 4 times in the last 25 years that happened.
The purple vertical line is the date that this occurred.
We don’t have to be super-geniuses to see what occurred over the next months after this “overbought” reading. In all cases, we are higher.
This guaranties us nothing but its important to note that this current perma bear narrative is also wrong. Let’s continue to trade what we can see and prove and I will see you guys next time.


I am a rank amateur but I started calling BS on "overbought" very early. Perma-anything is no good in this space. Thanks for always shooting straight.