Bitcoin and Cryptocurrency
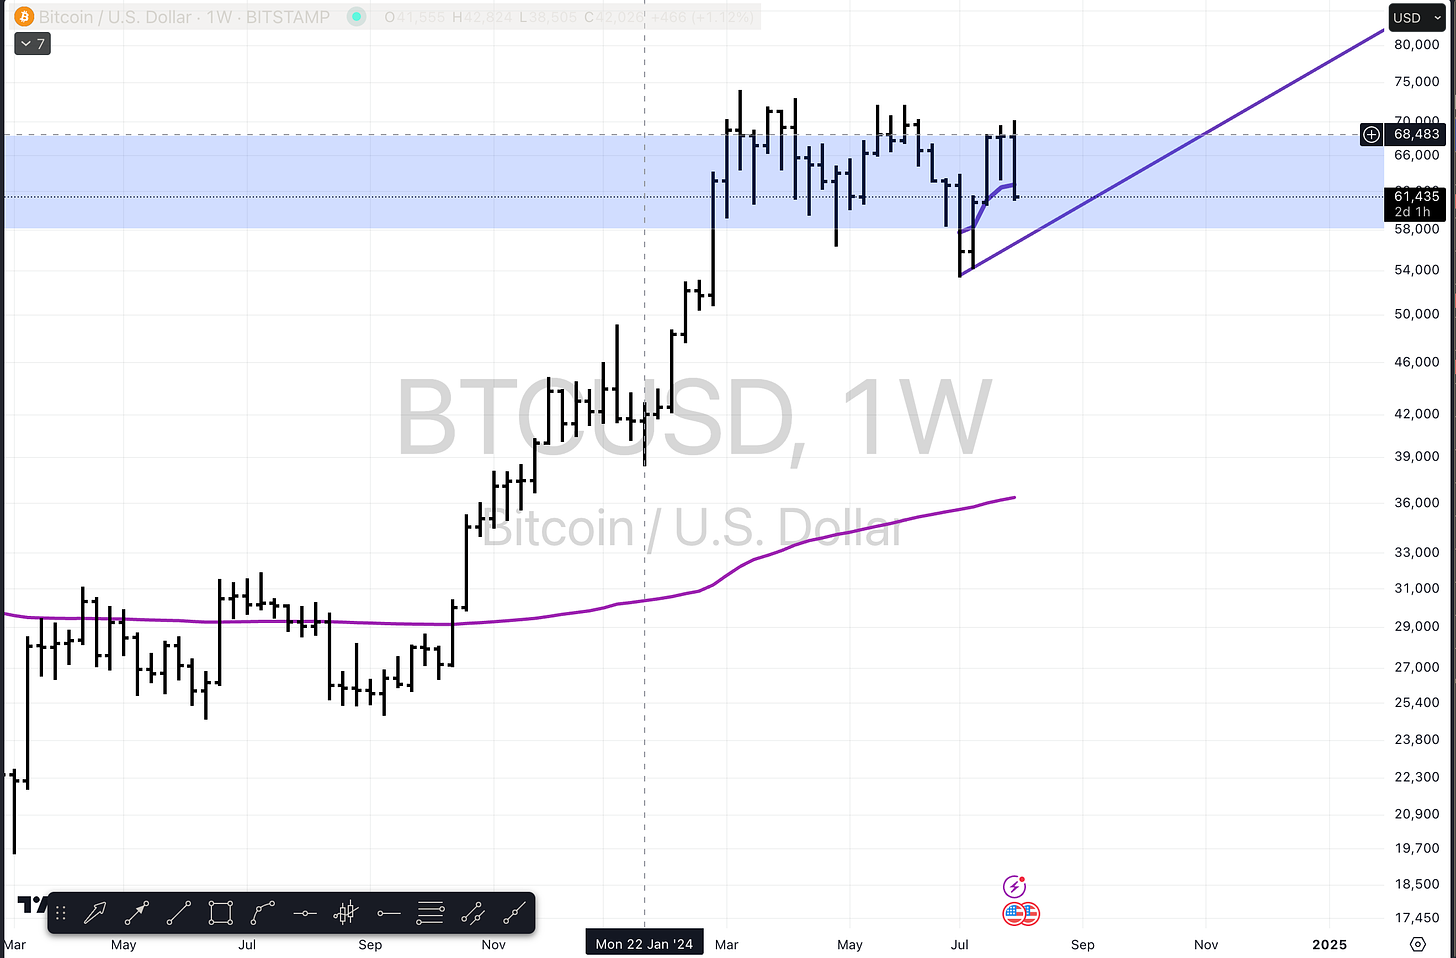
Starting with Bitcoin, we noticed a bit of a bad week. However, on the weekly chart, it still forms a bull flag pattern. Until this resolves, we will treat it as a potential bullish setup. If it breaks down and holds below key levels, it might be time to move to cash or short positions.
Ethereum follows a similar pattern, maintaining its consolidation phase. Solana, representing altcoins, is also holding above its prior lows, suggesting potential stability despite the recent pullback.
Dollar and Forex
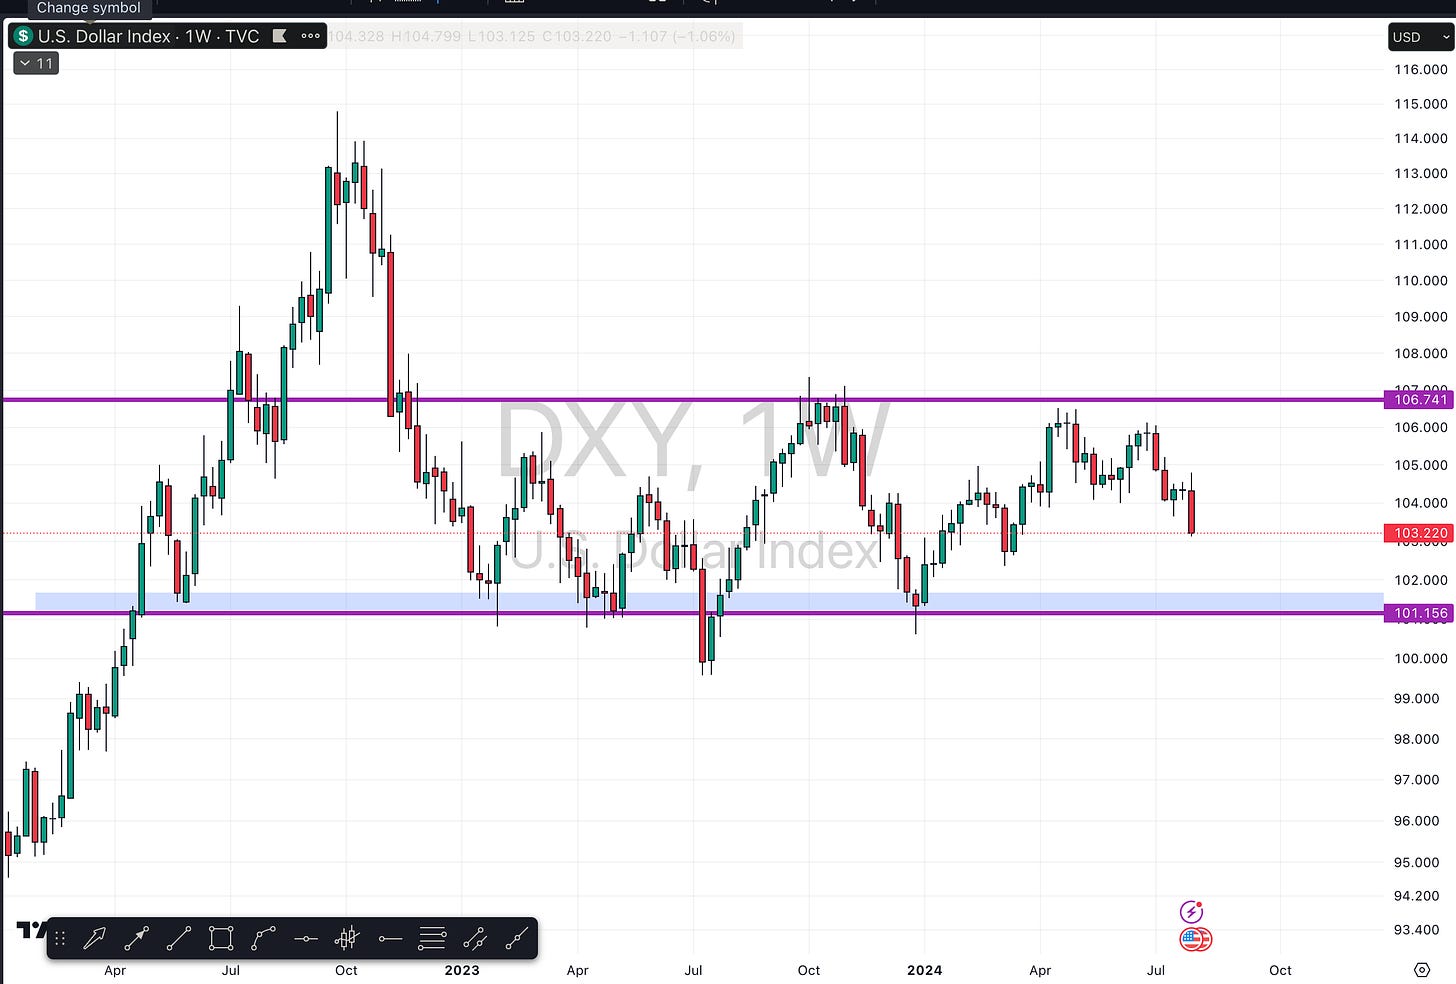
The US Dollar Index (DXY) experienced a selloff this week, breaking the previous inverse correlation with stocks. We still see room for further downside to significant support levels. USD/CHF had a particularly bearish candle, suggesting any weak bounce could be a shorting opportunity.
The Euro showed strength, breaking out of a wedge pattern. The Yen continues to fall, with significant moves following the Bank of Japan's intervention. Shorting any bounce in the Yen could be a strategic move, aligning with the central bank's stance.
Stock Market Analysis
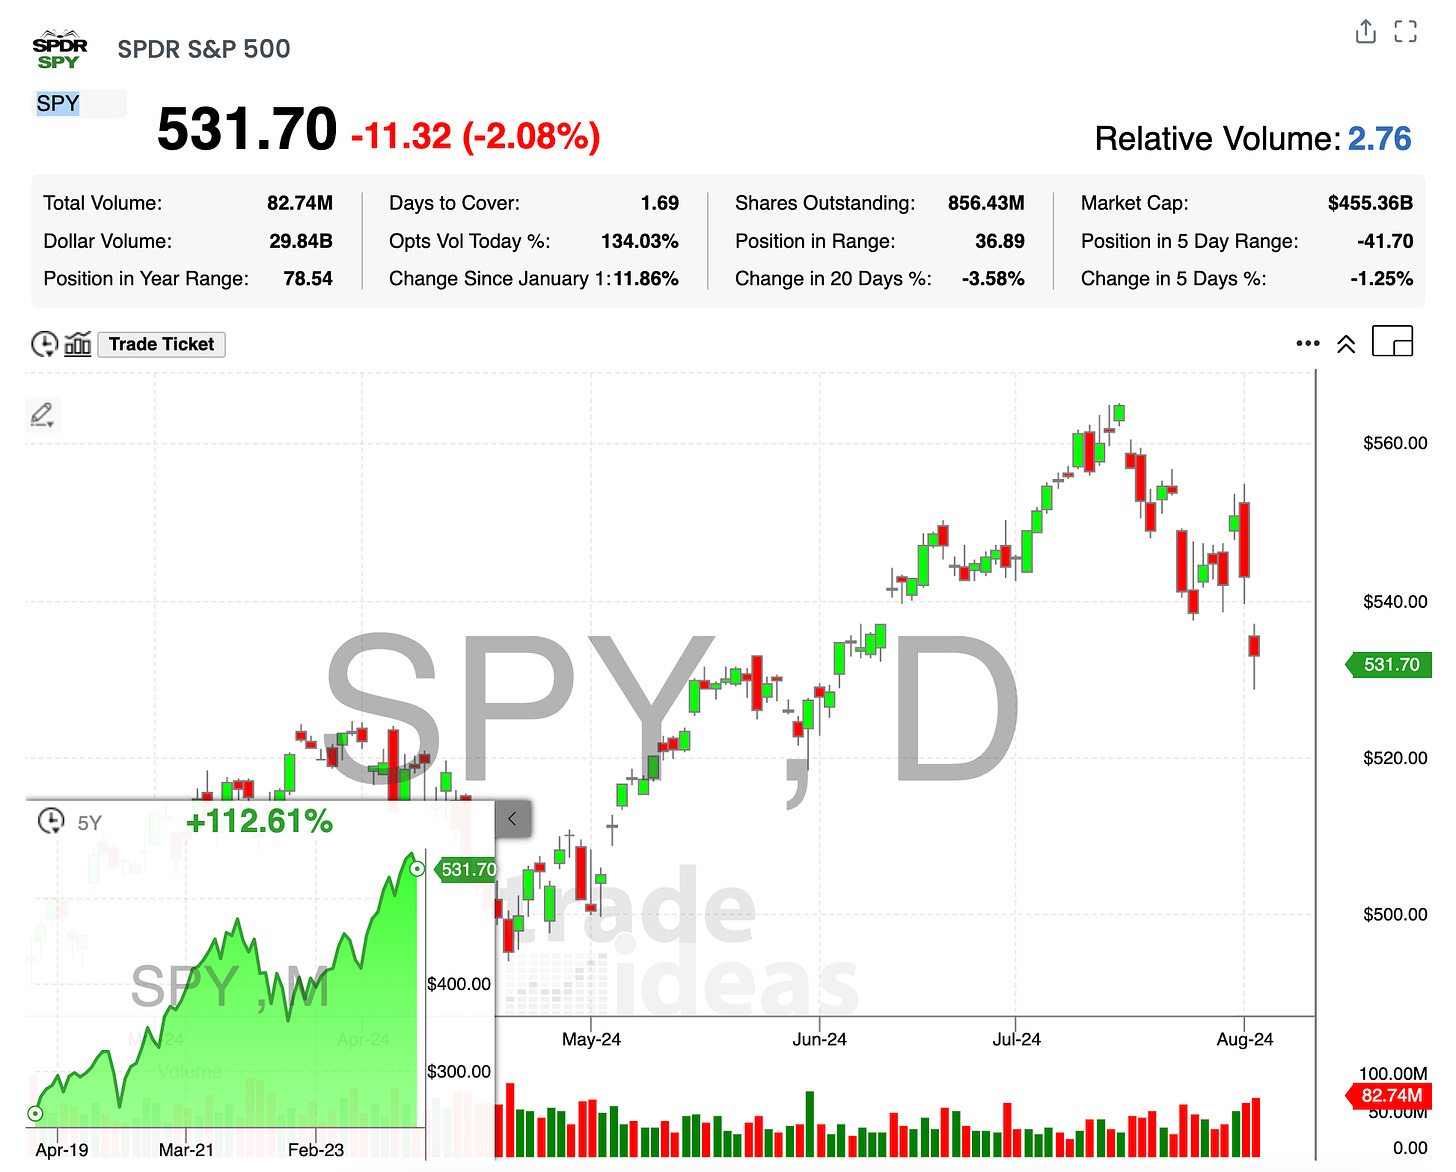
Despite the market downturn, the SPY shows a bottoming tail, suggesting potential support at current levels. The RSP, an equal-weighted S&P 500, indicates that the average stock remains in a range and not in crisis mode.
Semiconductors (SMH) had a tough three weeks but zooming out shows that the current pullback could find support at lower levels. This is a normal market behavior of ups and downs.
Sector Review
Bonds and Utilities: As expected, these safe havens performed well. XLU (Utilities) remains strong, reflecting its defensive nature.
Regional Banks (KRE): Despite an ugly week, it's at a significant support level. Holding this zone could present a reversal opportunity.
Solar (TAN): Holding its lows, solar stocks might see a rotation of capital if they break above key resistance levels.
Healthcare (XLV): This sector broke prior all-time highs and showed relative strength, making it a solid area to watch.
FXI (Large Cap Chinese Stocks): Approaching an anchored VWAP from a significant low, this orderly pullback could be a buying opportunity if it holds.
Conclusion
The market's recent volatility is part of its natural ebb and flow. As systematic traders, we prepare for both uptrends and downtrends. This involves identifying sectors and stocks that hold support during selloffs, indicating potential strength when the market turns.
Elections often brings choppiness to the markets, which we are currently witnessing. This aligns with historical patterns of volatility during election years.
At Stats Edge Pro, we use both breakout trend-following algorithms and pullback algorithms. Given the current market conditions, we might lean more towards the pullback strategy to capitalize on dips with clearly defined stop losses.
For more insights and access to our algorithms, visit Stats Edge Trading. Thank you for joining, and stay informed as we navigate these market conditions together.


