Unraveling the S&P 500 Monthly Charts
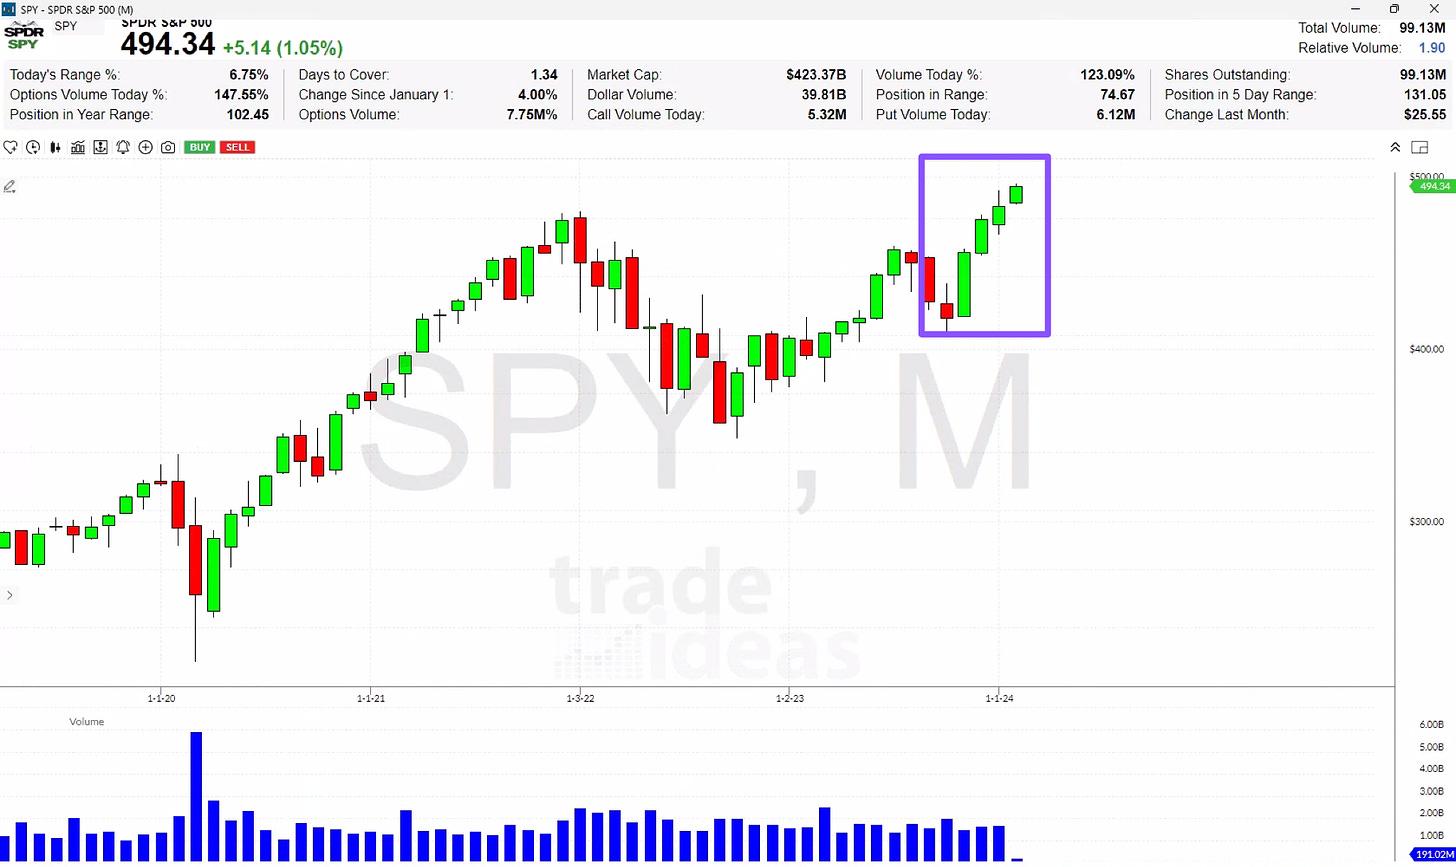
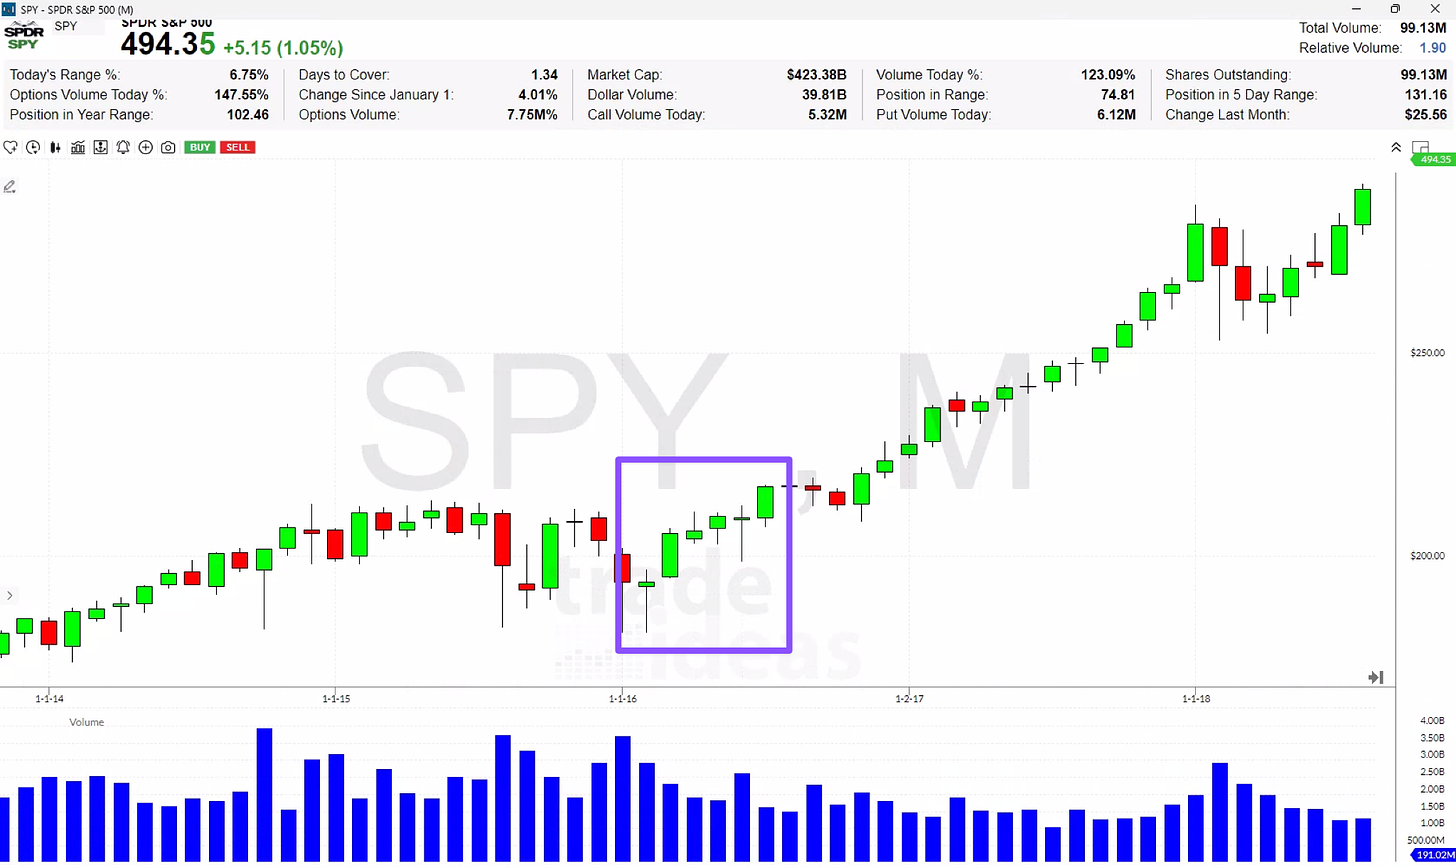
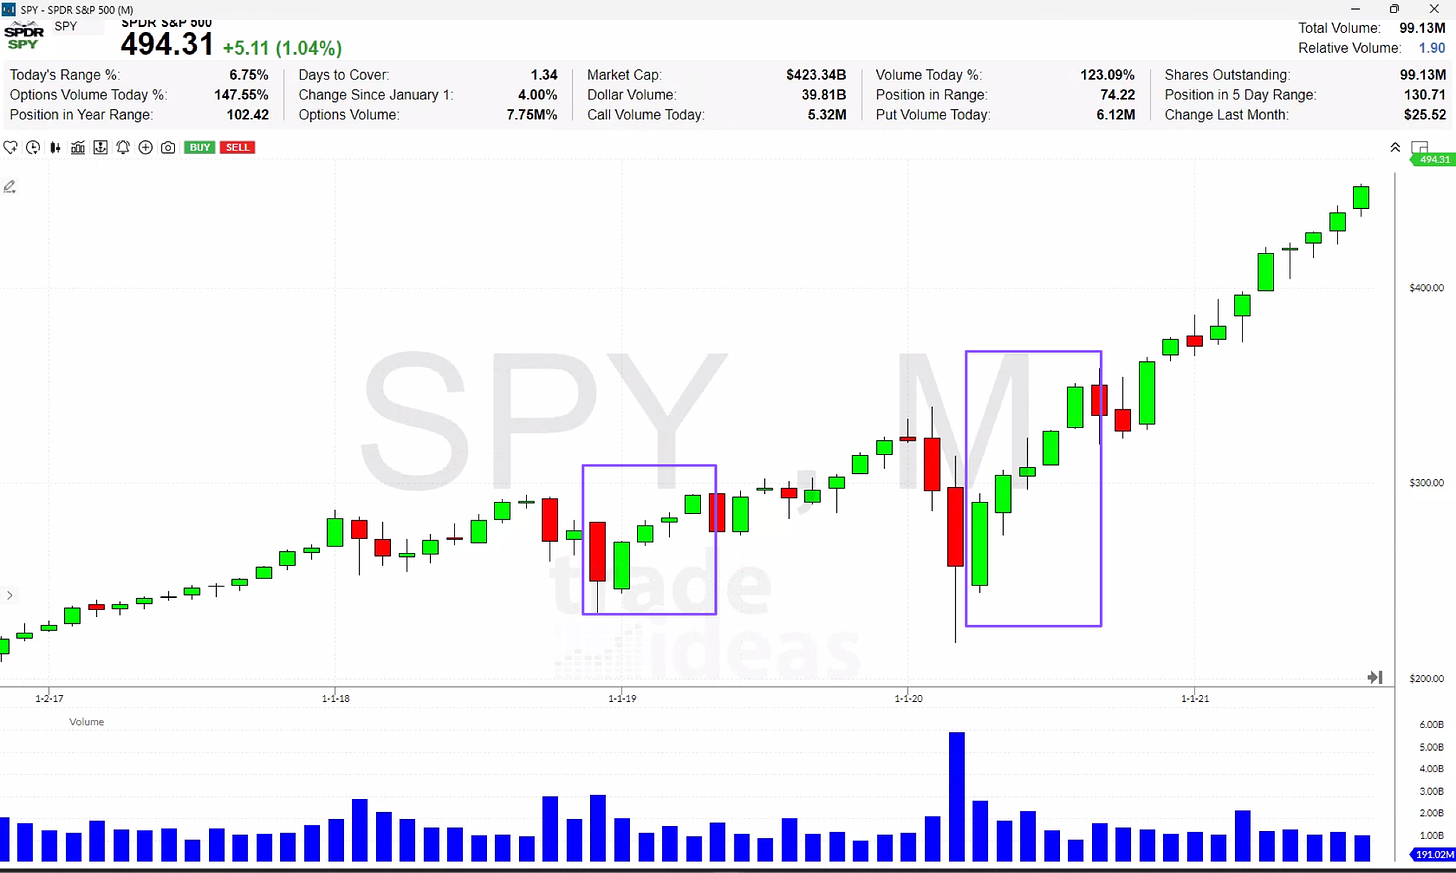
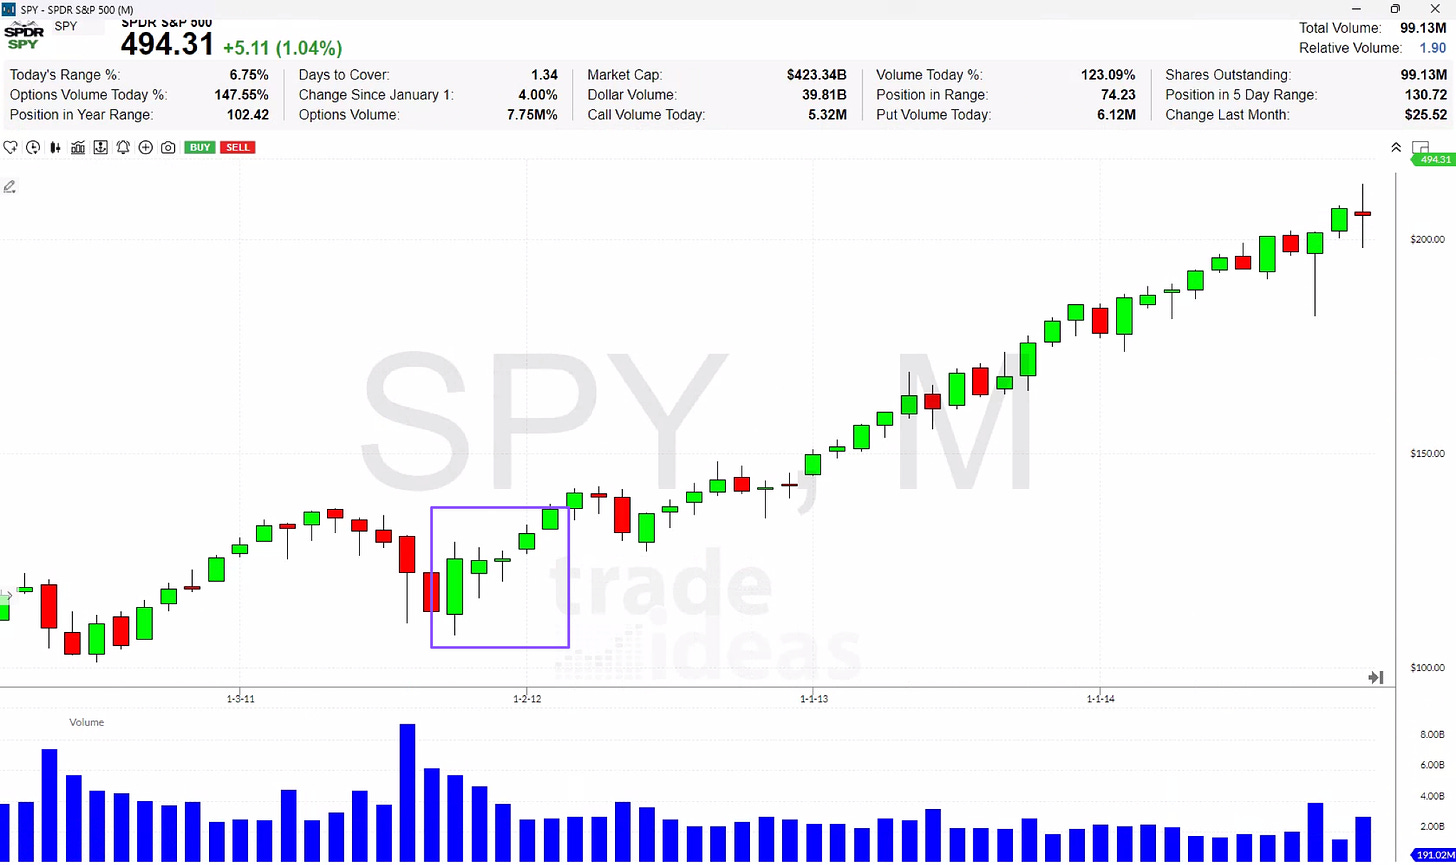
Preparing for a tradertv segment looking at monthly charts of the S&P 500 I noticed a recurring pattern. When the market took a while to get to a breakout spot, that movement was followed by 5-to 6 months of choppy action before resuming the trend. This makes sense on its surface but I think there is a benefit to showing the charts behind this.


