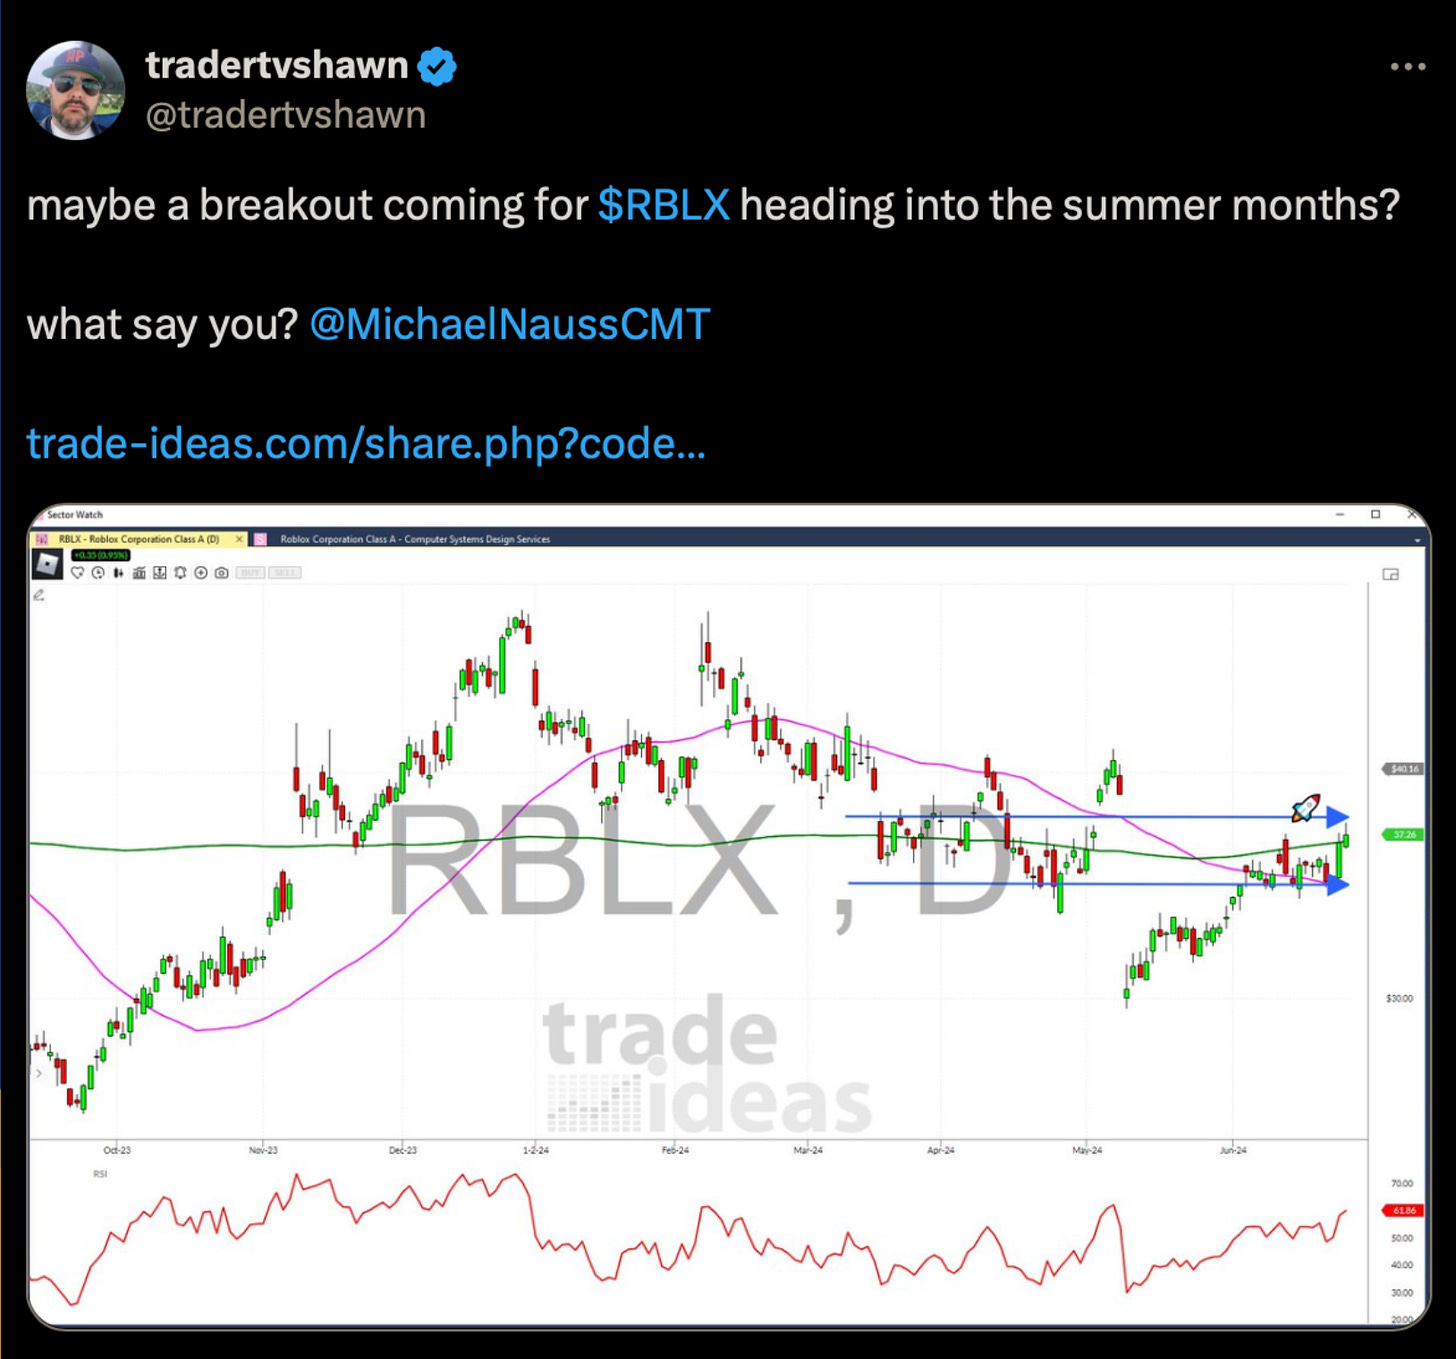
This idea comes from a good friend over at Trader TV Live. If you have not yet tuned in, they are a show made by active traders and for active traders. I hang out there on Monday and Friday mornings at 8:45 EST and Monday evenings right after the close. Check them out HERE.
My Buddy Shawn shows the above chart and asks my thoughts about RBLX 0.00%↑. I know all the kids play but as always the charts will tell us the story so lets look there.
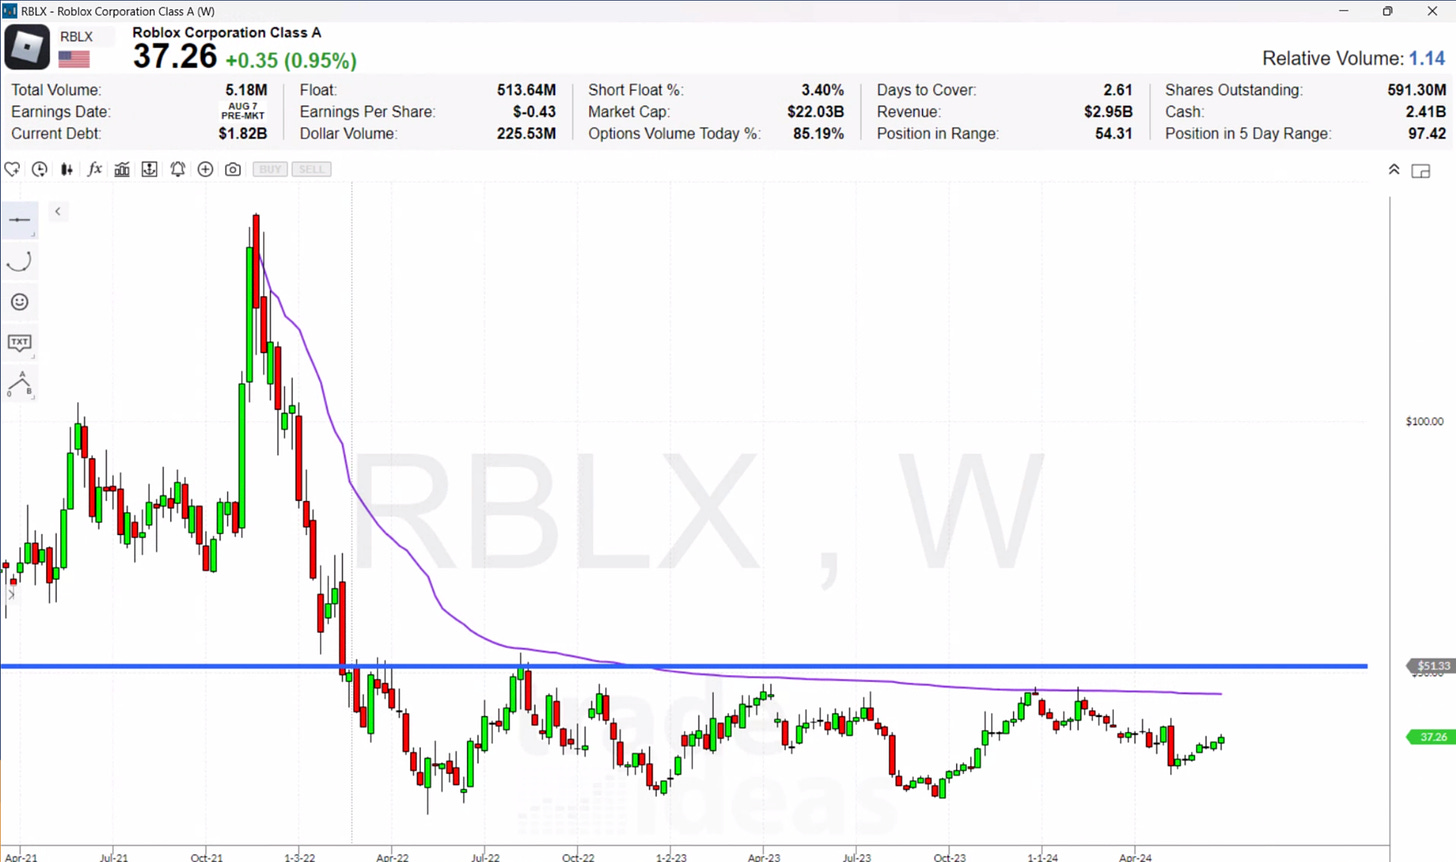
A long term weekly chart shows us that we are stuck in a large low base after a big sell off in 2022. This shows that the market has reached a point in which (at least for now) investors will buy the stock at this level where as before during the sell off there is no one of interest.
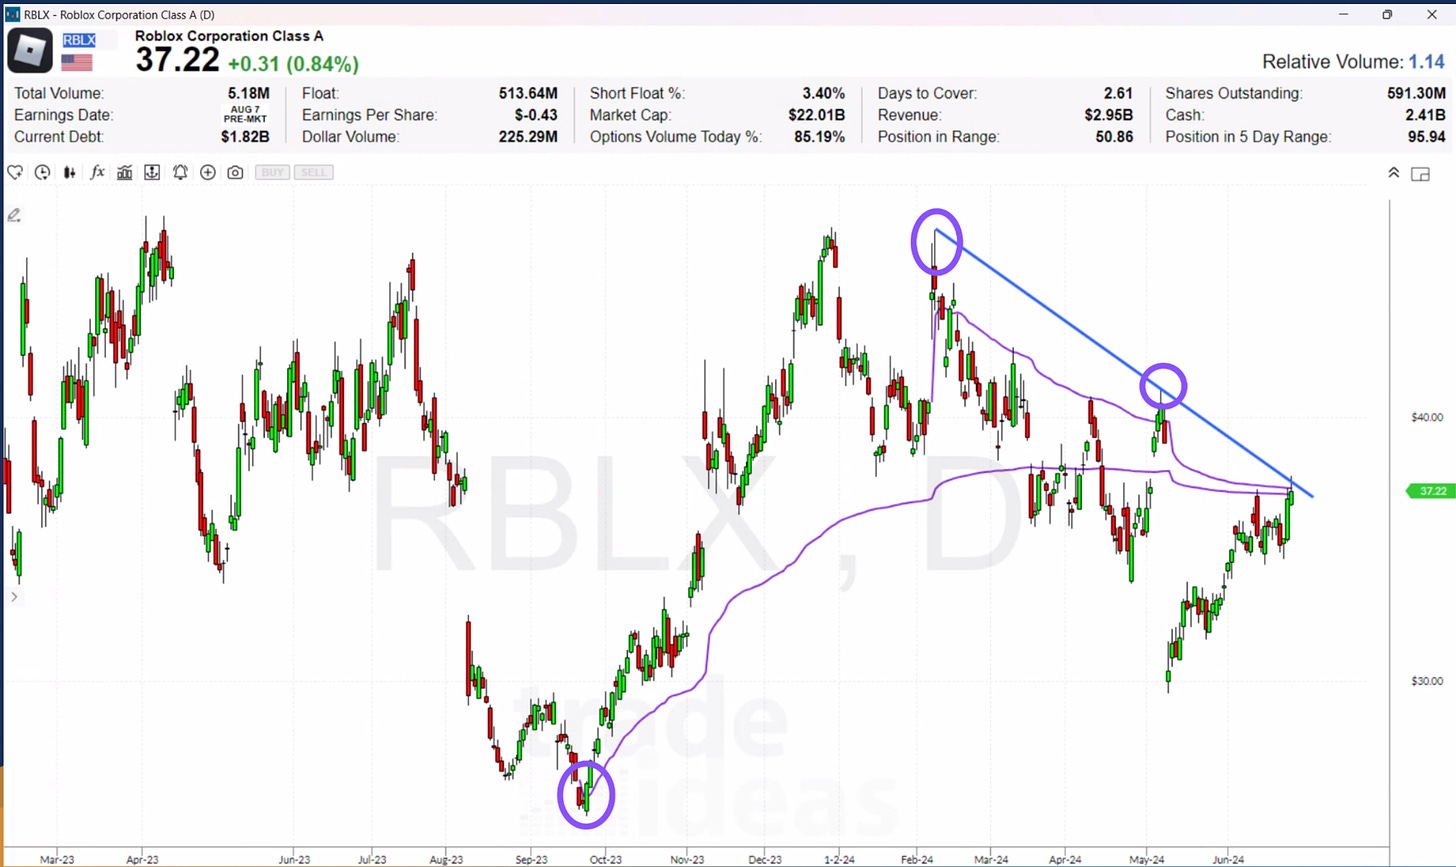
The daily chart shows we are hitting our head on a really important area with AVWAPs from the major Oct 23 low and March 24 highs along with its intermediate downtrend line. We need to see this area clear for a green light to move higher.
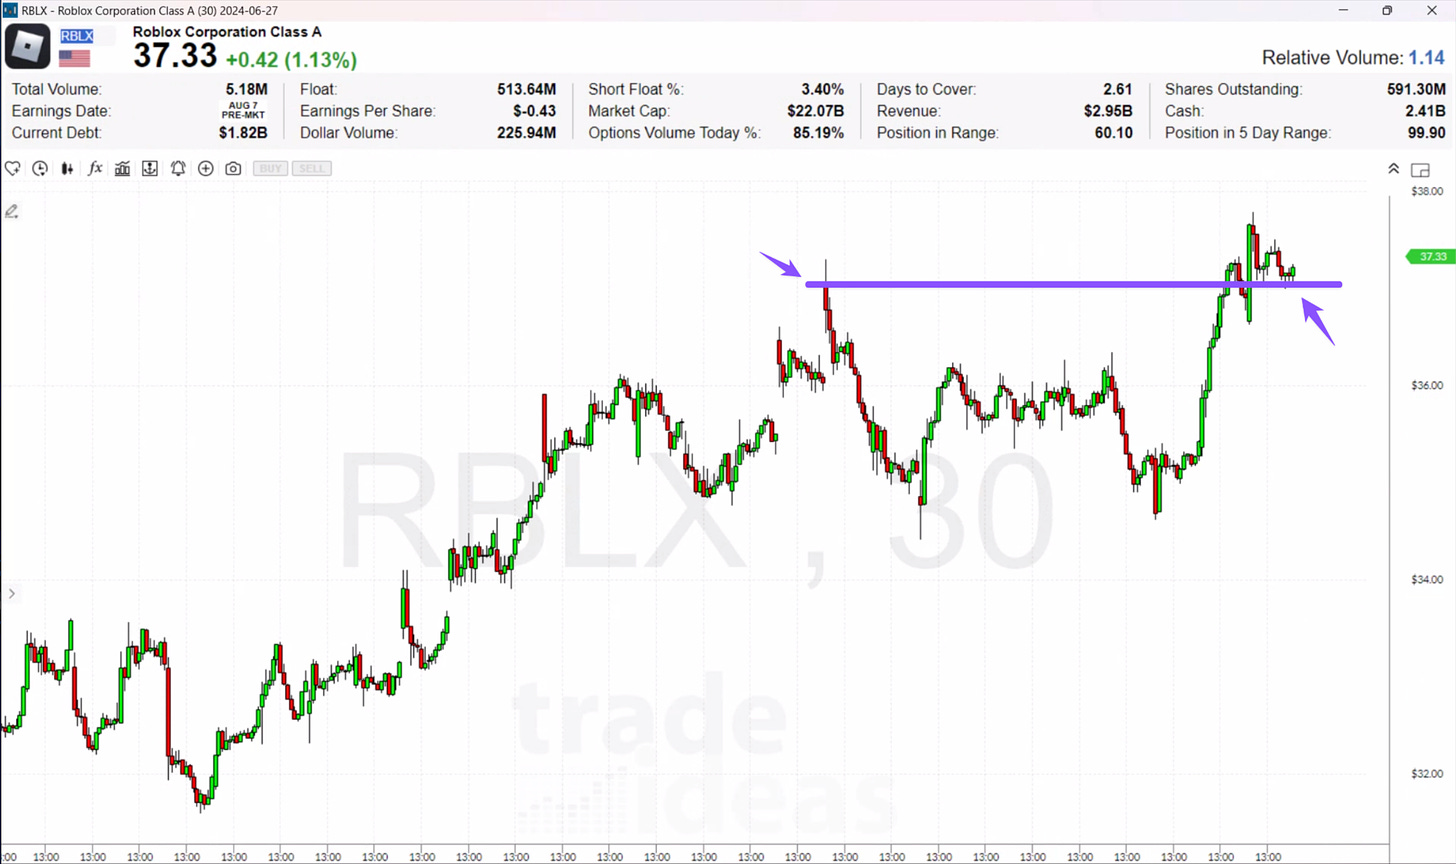
Looking intraday for entires idea we see a pretty important level at $37. For me that would be the level to play off of. If we hold that level, I am going to look to be long, and if we lose that level in any substantial way then its time to go.
As always these are just some ideas for what I might be doing with my money tomorrow. Make it your own.
Also very very soon I will be opening the door even more to my systematic trading process so stay turned for that.


THANKS